API rate limits at scale: how quotas are counted, what a key shares with an address, and a retry policy that holds
The job was a catalogue sync for a retail client. Three platform APIs, 384,000 calls on an ordinary day, a five hour window before the morning export had to be on somebody's desk. I built the first version the way most of us do: a worker pool, a semaphore, a sleep between calls, a loop that repeated anything that failed. It ran quietly for eleven days. Then the client opened two more warehouses, I raised the worker count from 20 to 60, and the pass started refusing itself: about 40,000 calls came back with a limit answer, my repeat loop turned those into roughly 90,000 calls, and the export landed four hours after the meeting.
Nothing in that story is the API being unfair to me. The budget I had was the budget I had. I spent a fifth of it on my own repeats and never wrote down where any of it went, so I had no way to tell a shortage of budget from a client that was wasting it. What follows is how these counters are built, what changes when you add a key and what changes when you add an address, how the queue and the repeat policy fit together, and how to compare the number the provider charges against the number your own code believes. The figures come from three APIs I have kept running for a long stretch: a marketplace listing API, a places API, and an ad reporting API.
Three counters run at once and only one of them refuses you
A rate limit is a counter with a scope attached. The scope decides who shares the budget, and every platform I work with runs several scopes at the same time. A call passes through all of them and the strictest one answers.
| Counter scope | What it counts | What a second key does to it | What a second address does to it |
|---|---|---|---|
| Per key | calls signed with that key | splits the load in two | nothing at all |
| Per source address | calls arriving from that address | nothing at all | splits the load in two |
| Per account or project | everything billed to the account | nothing at all | nothing at all |
| Per endpoint, inside a key | calls to one path under one key | splits within that key | nothing at all |
| Per object | writes touching one listing id | nothing at all | nothing at all |
Those last two rows cause most of the confusion I see in other people's code. On my marketplace API the key budget sits at 20 calls per second, and the search path inside that same key allows 5. A worker pool that reads the documented figure of 20 and pushes search calls at 18 per second sees refusals from the first minute, and the refusal body names a limit the developer swears is not being crossed.
The per object counter is stranger and worth knowing about before it appears. One listing id accepts 1 write every 4 seconds regardless of key, address or account, because the platform serialises edits to a single record. Twelve workers editing the same popular listing in the same second produce eleven refusals and one success, and adding capacity to that job makes the number worse in a way that nothing in the account settings explains.
What a second key buys and what a second address buys
I measured this on a read-only endpoint over four layouts, twenty minutes each, ramping the rate until refusals crossed 1 percent of calls. Same endpoint, same payload shape, same hour of the day on four consecutive nights.
| Layout | Keys | Exit addresses | Rate it held | Which counter answered first |
|---|---|---|---|---|
| Single key, single address | 1 | 1 | 9.5 per second | the key bucket |
| Single key, spread over exits | 1 | 8 | 9.6 per second | the key bucket, unchanged |
| Eight keys, one address | 8 | 1 | 14.8 per second | the per address counter |
| Eight keys, one address each | 8 | 8 | 71 per second | the daily project cap, in hour 6 |
| Eight pairs, paced to the plan | 8 | 8 | 21 per second for 5 hours | nothing refused anything |
Read the second row twice. Spreading one key over eight exits moved the sustained rate by about 1 percent, because the counter that was refusing me was attached to the key and the key travelled with every call. I have watched three teams buy address capacity to fix a key limit and then conclude that addresses do nothing, which is the wrong lesson taken from a correct measurement.
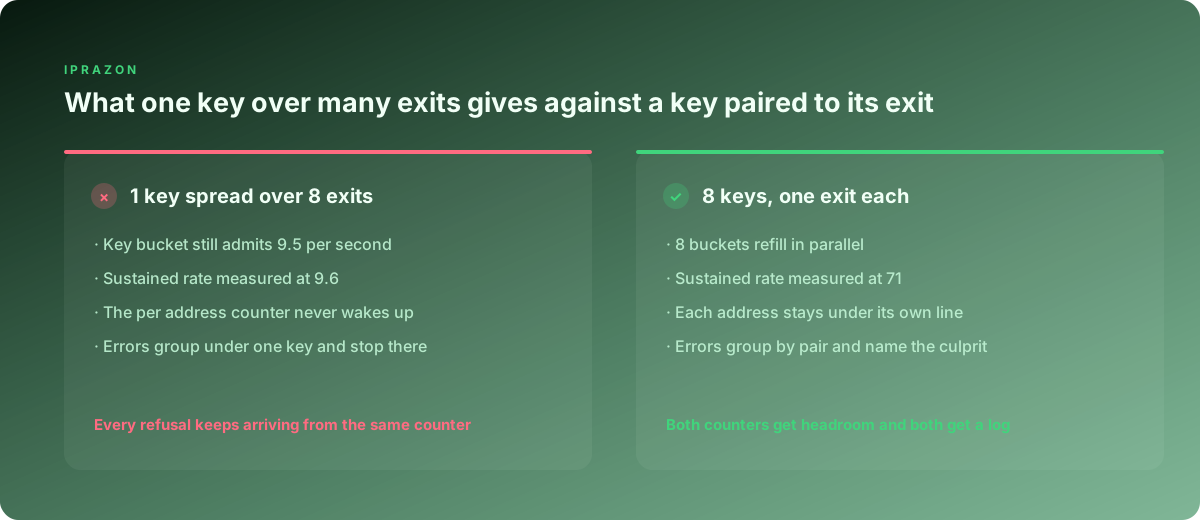
Row three is the mirror image. Eight keys firing through one address stack onto the per address counter, and my measured ceiling of 14.8 per second sat well below the 76 per second those keys were entitled to between them. The address counter also has a longer memory than the key bucket on two of my three APIs: after a burst, that address stayed slow for about 90 seconds while the key buckets had already refilled.
So the layout I keep is one key bound to one address, fixed for the life of the key. Each pair carries its own bucket, its own error rate and its own line in the summary, and when one pair behaves differently to the other seven I know which half to look at. For that binding I take server addresses with a rate I set myself, since the arithmetic above only holds when the per address ceiling belongs to me. I keep IPv4 addresses pinned one per lane so the mapping between a key and an address survives restarts, and I use private addresses held by a single tenant because the per address counter counts calls without asking who made them, and an address with somebody else's morning already on it starts my pass part way through its budget.
The shape of the window sets the pace
Two APIs with the same headline figure of 600 calls per minute behave nothing alike, because the window underneath that figure has a shape.
| Window shape | How the budget comes back | Burst it forgives | Where it bites |
|---|---|---|---|
| Fixed window of 60 s | all of it, on the minute boundary | the full minute in one second | two full budgets land back to back across the boundary |
| Sliding window, per call log | continuously, as calls age out | almost none | a slow bleed of refusals that never quite clears |
| Token bucket, 10 per second, depth 50 | 10 tokens a second, capped at 50 | 50 calls at once, once | a quiet worker builds credit, then floods |
| Daily quota, resets at a fixed hour | once, at the reset hour | the whole day in one hour | a morning burst leaves the evening with nothing |
The fixed window boundary is the one that reached me last. My pacing was correct by the counter and wrong by every other measure: 600 calls in the last second of one minute and 600 in the first second of the next, which the counter permitted twice over and the protection layer in front of the API read as one client doing something odd. Refusals arrived with no limit crossed anywhere in my own numbers.
Since then I pace to the average and keep the burst allowance at a fifth of the window budget. On the same 100,000 calls, a burst-then-idle pattern produced 3,800 refusals, and an even pace at the identical average produced 41. The budget never changed. The distribution did all the work, and the pass finished 22 minutes earlier because none of those refusals turned into waiting.
Reading the headers the API sends about its own budget
Two of my three APIs describe their counters on every response, and the third only speaks up when it refuses. I parse whatever arrives into one internal shape: budget, left, reset time, scope name. Everything downstream reads that shape and none of my call sites know which header dialect produced it.
The steering rule earns its keep. When the remaining share on a lane drops below 15 percent of its budget with more than half the window still to run, that lane halves its own pace until the reset. My refusal share across the whole pass went from 3.8 percent to 0.4 percent the week I added those four lines, and no lane finished its window with unspent budget.
One detail took me two evenings to work out. The headers describe whichever counter came closest to refusing that particular call, and it changes between responses, so a lane can be told about the key bucket at one moment and the project cap at the next. Storing the numbers without the scope name gives you a graph that jumps for no visible reason. I keep the scope with every reading and hold the last figure per scope per lane.
The 403 answer covers three refusals that need different handling
An api rate limit does not always announce itself politely. On one of my APIs a spent budget arrives as 403 with a reason string in the body, and a missing permission arrives as 403 with a different reason string in the same field. My first classifier read the status code alone, which meant a key that lacked a scope was repeated with backoff, forever, spending budget on a call that could never succeed.
Over one quarter I collected 24,800 responses with that status. 71 percent carried a quota reason, 22 percent came from the protection layer sitting in front of the API with an HTML body and no JSON at all, and 7 percent were permission problems on a key that had drifted out of sync with the account. Three populations, three correct responses, one status code across all of them.
So the classifier reads the body before it decides anything. A quota reason parks the lane until the reset time and lets the other lanes carry on. A permission reason stops that key, marks it in the summary and pages nobody, because a paused key is a report and a repeated key is a slow leak. A protection layer answer is a fact about the address and the client shape, and it goes to a different queue that repeats once through the same pair and then hands the pair a rest period.
The queue: one lane per pair, one gate per counter
The queue holds work items and knows nothing about limits. The gates hold limits and know nothing about work. A call leaves only when every gate it touches admits it, and the gates are cheap enough that checking three of them costs less than a microsecond of thought.
import time, threading

class Bucket:
    def __init__(self, rate, depth):
        self.rate, self.depth = rate, depth
        self.tokens, self.at = depth, time.monotonic()
        self.lock = threading.Lock()

    def take(self, n=1):
        with self.lock:
            now = time.monotonic()
            self.tokens = min(self.depth, self.tokens + (now - self.at) * self.rate)
            self.at = now
            if self.tokens >= n:
                self.tokens -= n
                return 0.0
            return (n - self.tokens) / self.rate      # seconds to wait

GATES = {
    "key:k03":   Bucket(rate=20, depth=20),
    "exit:a03":  Bucket(rate=15, depth=30),
    "project":   Bucket(rate=90, depth=180),
}

def admit(names, units=1):
    while True:
        waits = [GATES[n].take(units) for n in names]
        if max(waits) == 0.0:
            return
        time.sleep(max(waits) + 0.02)
Two things in that snippet came out of failures. The gate returns the wait in seconds, so a lane sleeps the exact amount and stops polling, and every gate takes the unit weight of the call, since a search page that costs 100 units has no business taking one token from a budget measured in units.
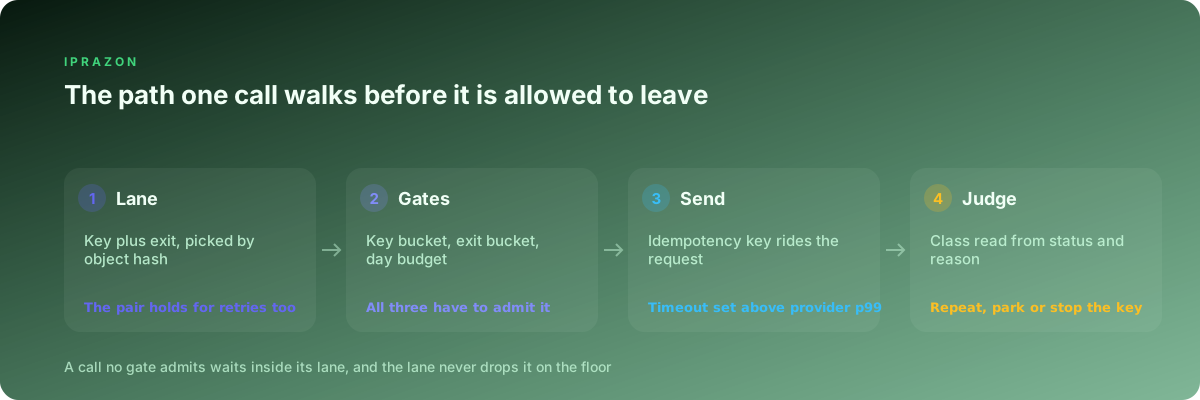
The lane is picked by hashing the object id, so the same listing always goes through the same key and the same address across the whole pass and across nights. That stability is what makes a per pair comparison meaningful. I run each worker's traffic through a SOCKS5 endpoint bound to the worker, which keeps the tunnel, the session and the key together for the length of the lane's work.
Priorities, and what yields when the day gets tight
Three classes share the same gates. Interactive work has a person waiting on the other end of it. Scheduled work has a deadline in hours. Backfill work has a deadline in weeks and exists to fill gaps nobody is currently asking about.
Weights alone were not enough. What made the split behave was a yield rule tied to the daily budget: when the share of the day's units already spent runs more than 10 points ahead of the share of the day that has elapsed, backfill stops taking tokens and waits. On my heaviest day this quarter backfill sat paused for 2 hours and 10 minutes, interactive calls held a 95th percentile wait of 40 milliseconds against the gates, scheduled work held 2.4 seconds, and every deadline landed.
Backfill also has a floor of 5 percent of tokens, because a class that can be starved forever will be, and a backfill queue that never drains turns into a second project six months later. The floor costs interactive work nothing I can measure and it keeps the gap list shrinking on the quiet days.
A repeat policy written as a table and then as code
A repeat is a second charge against the same budget, so the policy has to say which answers deserve one. Mine lives in a table that the code reads directly.
| Answer from the API | Repeat it | Wait before the next attempt | Attempts | Note |
|---|---|---|---|---|
| 429 with a wait header | yes | the header value plus 0.3 to 1.2 s of jitter | 5 | the header wins over any formula |
| 429 with no header | yes | 1 s doubling to a cap of 32 s | 5 | full jitter on every step |
| 500, 502, 503, 504 | yes | 0.5 s doubling to a cap of 8 s | 4 | the lane opens a circuit at 20 percent |
| Connect timeout, read timeout | yes | 2 s flat | 3 | count the attempt as units spent |
| 403 with a quota reason | park | until the reset time in the headers | 1 | the lane sleeps, its neighbours do not |
| 403 with a permission reason | no | none | 0 | stop the key, write it in the summary |
| 400, 404, 422 | no | none | 0 | the payload is wrong and waiting will not fix it |
Three rules sit around that table. Total attempts across the pass are capped at 6 percent of planned calls, and crossing that cap stops the pass and pages me, since a pass that spends a tenth of its budget on second attempts has a problem that waiting will make worse. Each lane carries a circuit that opens when its refusal share crosses 20 percent over a rolling minute, closes after one probe call succeeds, and reports both events. And every wait uses full jitter, drawn uniformly between zero and the computed ceiling, because eight lanes that back off by an identical formula come back in step and rebuild the burst that caused the trouble.
import random, time

TERMINAL = {400, 404, 422}

def classify(resp):
    if resp.status_code == 429:
        return "wait", float(resp.headers.get("retry-after") or 0)
    if resp.status_code == 403:
        reason = (resp.json() or {}).get("error", {}).get("reason", "")
        return ("park", 0.0) if "quota" in reason else ("stop", 0.0)
    if resp.status_code in TERMINAL:
        return "stop", 0.0
    if resp.status_code >= 500:
        return "wait", 0.0
    return "ok", 0.0

def backoff(attempt, base, cap):
    return random.uniform(0, min(cap, base * (2 ** attempt)))
The numbers moved once this was in place. On a bad day under the old loop, second and third attempts were 34 percent of everything my pool sent. Under the table above they hold at 2.4 percent, and the pass now finishes 40 minutes earlier than its previous best, because the budget I stopped wasting on repeats went to calls that returned data.
Idempotency, so a repeat never lands twice
Any repeat policy needs an answer to the call that succeeded on the server and failed on the way home. My client gave up at 10 seconds while that provider's 99th percentile sat at 12.4, so a slice of my timeouts were writes that had already been applied. I found that out when a repeat created 143 duplicate listings and the client called about it.
Where a provider supports an idempotency header, the same value rides every attempt of one logical operation, and the server collapses them. Where no such header exists, a local ledger does the same job before the call leaves.
import hashlib, json

def op_key(endpoint, payload, op_id):
    canon = json.dumps(payload, sort_keys=True, separators=(",", ":"))
    return hashlib.sha1(f"{op_id}|{endpoint}|{canon}".encode()).hexdigest()

def send_once(store, endpoint, payload, op_id, send):
    k = op_key(endpoint, payload, op_id)
    seen = store.get(k)                     # ledger with a 26 hour window
    if seen and seen["state"] == "done":
        return seen["result"]
    store.put(k, {"state": "sending"})
    r = send(endpoint, payload, headers={"Idempotency-Key": k})
    store.put(k, {"state": "done", "result": r})
    return r
The window is 26 hours because my longest pass runs 5 hours and I want yesterday's operations still visible when today's pass starts. In one month that ledger stopped 812 duplicate writes, most of them from the timeout case above, and the rest from a scheduler that queued the same object twice after a restart.
Reads are safe to repeat and they still cost budget, so the same hash serves as a cache handle with a short lifetime. Detail records that change rarely get a 30 minute lifetime, and that alone took 9 percent off my daily unit count without changing a single figure in the export.
Counting what a pass actually spent
Calls and units are different currencies and the provider bills the second one. My weights table shows why counting calls tells you nothing useful.
| Call type | Units per call | Share of my calls | Share of my units |
|---|---|---|---|
| Detail fetch | 1 | 71 percent | 9 percent |
| Search page | 100 | 12 percent | 61 percent |
| Report pull | 50 | 8 percent | 18 percent |
| Batch write | 25 | 9 percent | 12 percent |
Seventy one percent of my traffic takes under a tenth of the budget. When the daily cap arrived early, my instinct was to trim detail fetches, which are numerous and visible in every log. Trimming them by a third would have saved 3 points of budget. Caching one class of search page saved 22.
Then there is the gap between my count and theirs. My ledger claimed 214,600 units for a day the provider counted at 259,400, which is a fifth of a budget I did not know I was spending.
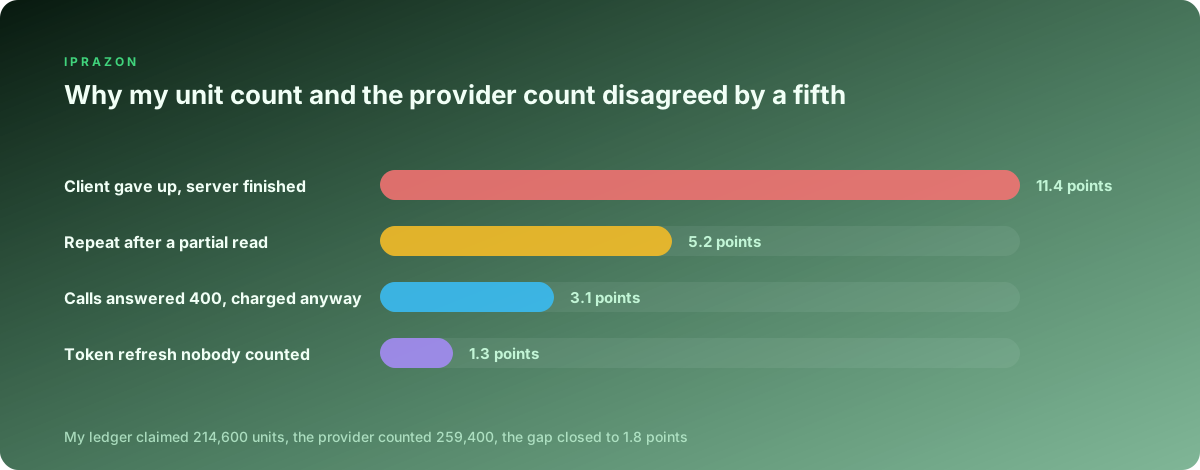
Every one of those four causes is my own accounting. A call my client abandoned had still been served, and the provider charged for it while my code recorded nothing. A repeat that followed a partial read charged twice on their side and once on mine. Calls answered with 400 are charged by that provider, which the documentation says plainly in a place I had not read. And the background token refresh ran through a code path that never touched the ledger at all. I moved the accounting to the moment an attempt leaves the process, and the gap fell to 1.8 points, which is close enough that I trust the ledger for planning.
The ledger line is one row per attempt, written whether the attempt worked or not.
{"call":"c7f19a02","op":"listing.update:88412","endpoint":"/v2/listings",
 "key":"k03","exit":"a03","attempt":2,"status":429,"reason":"rate",
 "units_expected":25,"units_charged":25,"scope":"key","left":118,"budget":2400,
 "reset_in_s":37,"waited_ms":1420,"latency_ms":392,"idem":"b41c…","class":"wait"}
Four fields there do the heavy lifting. The pair of key and exit lets me group any oddity by lane before I go looking at endpoints. The scope and left pair tells me which counter was nearest to refusing at that moment, which is the only honest answer to how much room a pass had. The attempt number separates work from rework in every count I produce. And units_charged next to units_expected is what turned a fifth of an invisible budget into four named causes I could each go and fix.
Sizing follows from those numbers with no guesswork left in it. My pass needs 384,000 calls in 5 hours, so 21.3 per second sustained. A key holds 9.5, so 3 keys carry the rate and I run 8 for headroom against parked lanes and per endpoint sublimits. An address holds around 15 per second on this API, so the pairing gives every key more address budget than it can use, which is the position I want when a lane has to catch up after a park. I keep the same addresses under a monthly lease that preserves the pairing so the key to address map stays stable across nights and a night to night comparison of refusal rates means something, and I use addresses that carry traffic without a meter because report pulls arrive as large bodies and a pass that slows down in its last hour ruins the arithmetic above. For the pool itself I run a datacenter pool sized per key, one address per key with a few spare, and the spares exist for the day a key gets parked and its work has to move.
People search for how to bypass a rate limit and the honest version of that question turns out to be different: find every counter that applies to you, spend the budget each one gives you at an even pace, and stop paying twice for the same call. The counters, the queue and the ledger are three days of work and they replace an argument with a number. Two more from this series sit next to this one, a 403 answer read from the source that issued it and how many addresses a job actually needs, and both follow the same order this piece does: measure the ceiling you already have, then add capacity against a figure you can defend.