
How to fix 403 Forbidden when you collect data: telling seven sources apart

The status line says the same thing every time. Access denied, three digits, no explanation attached. Behind that one number I have counted seven separate mechanisms across my own jobs, and every one of them wants a different repair.
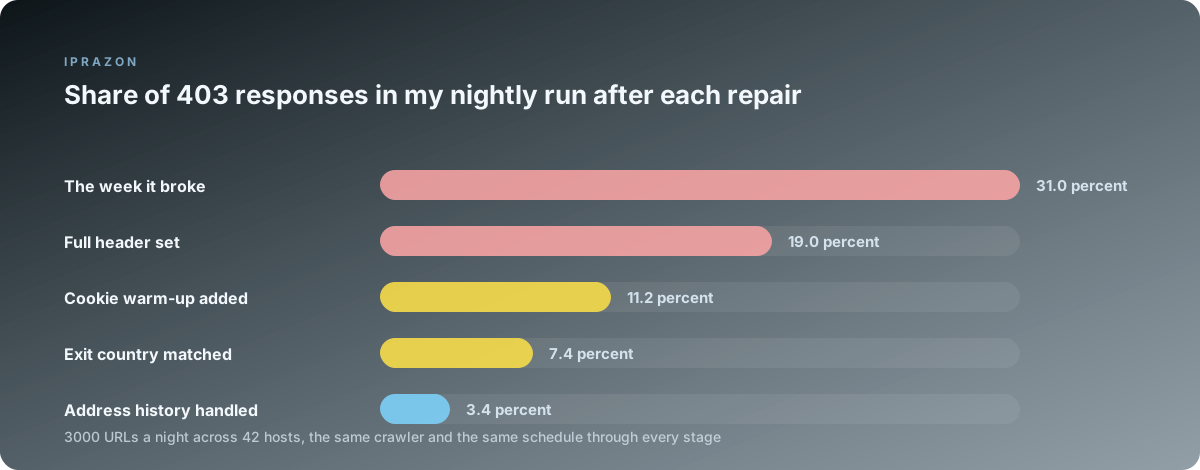
I run a price collector for a chain of hardware shops: 42 sites, roughly 3000 product URLs a night, 8 threads per host. For a long stretch my error rate sat at 0.4 percent, which is ordinary background noise. Then one week 403 responses reached 31 percent of the run and the morning export came out half empty. It took me 11 days to work through the whole thing, and most of those days went into repairs aimed at the wrong source.
What follows is arranged source by source. Each section gives the sign that identifies it, the probe I run to confirm the sign, and the repair that moved my numbers. The sections stand on their own, so if a sign matches what sits in your log right now, go straight to it.
One habit belongs before any of this. Log the entire response: status, every header, body length, and the first 400 bytes of the body. My collector recorded status codes alone for two years, and through those two years every 403 looked exactly like every other 403.
 # what my worker writes for every non-2xx response
row = dict(url=url, status=r.status_code, ms=int(r.elapsed.total_seconds()*1000),
           size=len(r.content), exit_ip=exit_ip, thread=tid,
           hdr={k: v for k, v in r.headers.items()
                if k.lower() in ('server','cf-ray','retry-after','www-authenticate',
                                 'set-cookie','x-amz-cf-id','content-type')},
           head=r.text[:400])
log.write(json.dumps(row, ensure_ascii=False) + "\n")
Reading the response before touching the crawler
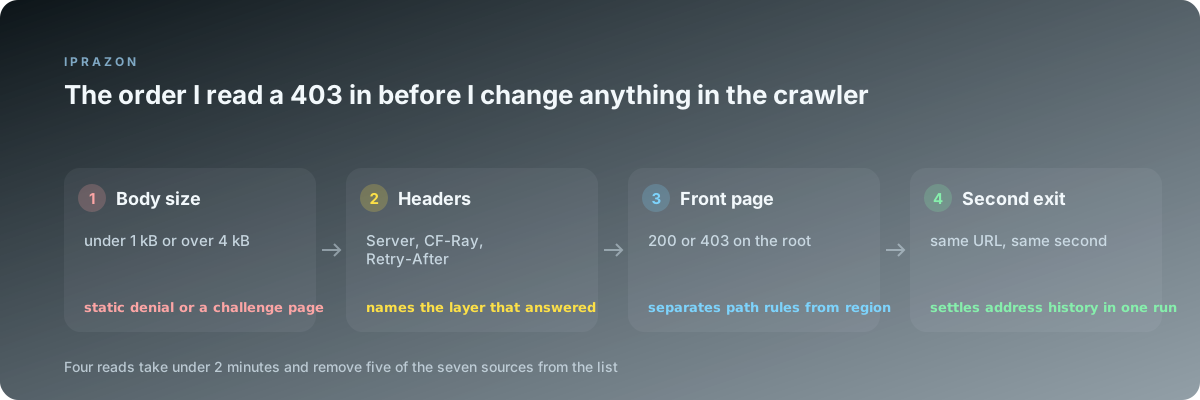
Four reads take under 2 minutes and remove most of the candidate sources from the list. I do them in a fixed order because each one narrows what the next one has to consider.
Body size comes first. A denial written by the site itself is small and static, usually 300 to 900 bytes, often a bare sentence in HTML. A protection layer answers with 4 kB and up, carrying script tags, a challenge identifier and sometimes a meta refresh. My 42 hosts split into those two groups on size alone.
Headers come second. Server, CF-Ray, X-Amz-Cf-Id and Via name whatever answered ahead of the application. WWW-Authenticate points at credentials. Retry-After points at pacing. Set-Cookie on a 403 is a strong hint that the site expected a cookie you did not send and is now handing you one.
The root URL comes third. Fetch the front page of the same host with the identical client. A 200 on the root and a 403 on the deep path puts the cause inside path rules, session state or headers. A 403 on the root as well pushes the question toward region and address history.
A second exit comes fourth. Same URL, same headers, same second, a different address. If one returns 200 and the other returns 403, you have your answer in a single run and the remaining sections mostly stop applying.
| What the response carries | How I read it | The probe that follows |
|---|---|---|
| Body under 1 kB, plain HTML | rule inside the application | header replay, then cookie jar |
| Body over 4 kB with scripts | a protection layer answered | client fingerprint comparison |
| Set-Cookie present on the 403 | session state was expected | warm-up request against the root |
| Server names a proxy vendor | the edge answered, the app never saw it | address A/B across 2 exits |
| WWW-Authenticate present | credentials or scope | token replay, expiry decode |
| Retry-After present | pace of requests | single-thread timing run |
| Content-Type is JSON | an API endpoint with its own rules | token and quota inspection |
Source one: the request carries none of the headers a browser sends
This is the source I meet most often on new hosts, and it is the cheapest one to settle.
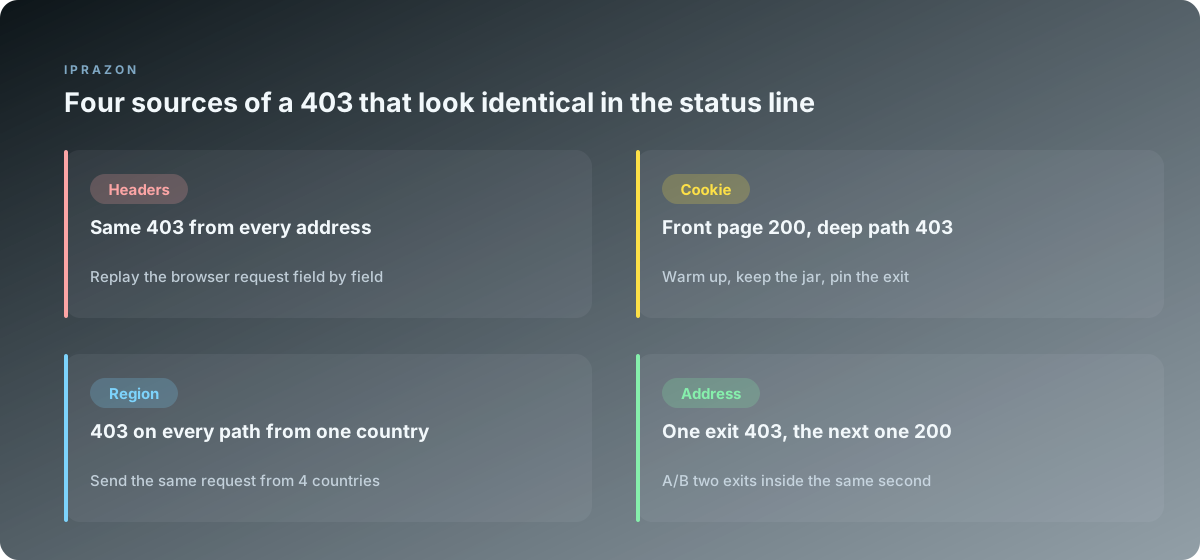
The sign is narrow and useful: the 403 arrives on the very first request, it arrives from every address you try, and the body is small and identical every time. A browser opened on the same URL from the same machine loads the page without complaint. The disagreement between your client and your browser is the whole signal.
The probe is a replay. Open the page in a browser, take the request through copy as cURL, run that command untouched from the shell, and confirm you get a 200. Then remove one header at a time until the 403 comes back. The header you removed last is the one the site checks.
 # replay first, then strip fields one by one until the 403 returns
curl -s -o /dev/null -w '%{http_code} %{size_download}\n' \
  -H 'user-agent: Mozilla/5.0 (Windows NT 10.0; Win64; x64) AppleWebKit/537.36 (KHTML, like Gecko) Chrome/126.0 Safari/537.36' \
  -H 'accept: text/html,application/xhtml+xml,application/xml;q=0.9,*/*;q=0.8' \
  -H 'accept-language: en-GB,en;q=0.9' \
  -H 'accept-encoding: gzip, deflate, br' \
  -H 'sec-fetch-site: same-origin' -H 'sec-fetch-mode: navigate' -H 'sec-fetch-dest: document' \
  -H 'referer: https://target.example/catalog/' \
  --http2 -x "socks5h://user:pass@$ADDR:$PORT" 'https://target.example/catalog/drills/'
On my 42 hosts the field that mattered was different almost every time. Nine checked Accept-Language and answered 403 when it was absent. Six wanted the three Sec-Fetch fields, and one of those six wanted sec-fetch-site to read same-origin, which meant my crawler had to walk from the category page down to the product page, since a direct jump to the deep URL drew a denial every time. Four looked at Referer and expected a path from the same host. Two answered 403 to any client speaking HTTP/1.1 on a host that serves HTTP/2.
Order counts as well. A default Python client sends its fields in an order no browser produces, and a handful of sites read that order. Keeping the header dictionary in browser sequence and disabling the library's own additions took one host from 100 percent 403 to 100 percent 200 with no other change.
The full header set brought my run from 31 percent down to 19 percent. That was the largest single step of the 11 days, and it cost an evening.
Source two: the session has no cookie the site issues on the front page
The second source hides behind the first, because both produce a 403 on a deep path with a small body.
The sign that separates them is the root URL. The front page answers 200, the deep path answers 403, and the 403 response carries Set-Cookie. Many sites hand out a session identifier, a consent value or a region token on the first visit and treat any request without it as anonymous traffic that has no business reading the catalogue.
The probe is a two-step run with a jar. Fetch the root while writing cookies to a file, then fetch the deep path while reading that file. If the second request returns 200, the source is settled.
curl -s -c jar.txt -o /dev/null -x "socks5h://user:pass@$ADDR:$PORT" https://target.example/
curl -s -b jar.txt -o /dev/null -w 'with jar: %{http_code}\n' \
     -x "socks5h://user:pass@$ADDR:$PORT" https://target.example/catalog/drills/
curl -s          -o /dev/null -w 'no jar:   %{http_code}\n' \
     -x "socks5h://user:pass@$ADDR:$PORT" https://target.example/catalog/drills/
Three details decide whether the repair holds up over a night of work. The jar belongs to one address: a cookie issued to one exit and replayed from another is a mismatch the site can see, and I have watched that combination produce a 403 on hosts that were happy with either address on its own. The jar has a lifetime, and on my set it ran from 12 minutes to 4 hours, so the worker refreshes it on a timer. The warm-up itself should look like a visit, which for me means root, then category, then the product page, with a pause of 1 to 3 seconds between them.
That is also where the split between pinned and rotating work comes from. Anything carrying a session runs on one pinned exit for the whole cycle, and the stateless half of the job, the listing pages and the sitemap walks, runs on rotation across a wide list of exits, which is where rotation pays the most: every request there stands alone and gains from a fresh address. Splitting the job along that line gave me both properties at once.
Cookie handling took the run from 19 percent to 11.2 percent.
Source three: the region behind the request sits outside the allowed list
Region rules produce the most consistent 403 of the seven, and consistency is what identifies them.
The sign: every path returns 403, including the root, including static files. The body often names availability or licensing in plain words. Every address you hold in one country behaves identically, and the response arrives fast, because the rule sits at the edge and never reaches the application.
The probe is a country sweep. Same URL, same headers, four exits in four countries, run within a few minutes of each other so nothing else can drift.
| Exit country | Root URL | Deep catalogue path | Body length | Time to first byte |
|---|---|---|---|---|
| Germany | 403 | 403 | 412 | 88 ms |
| Netherlands | 403 | 403 | 412 | 71 ms |
| United States | 200 | 200 | 61 kB | 240 ms |
| United Kingdom | 200 | 403 | 412 | 190 ms |
Three of those rows are easy. The fourth row is the interesting one: a 200 on the root and a 403 on the deep path from the same country means two rules stacked on top of each other, region for part of the catalogue and something else for the rest. I chased that host for two days before I noticed the split, and the second rule turned out to be the header check from source one.
The repair is a matter of picking the exit country the target expects and keeping the rest of the request agreeing with it. Accept-Language should match the region, the time zone in any browser profile should match, and the currency parameter in the URL should match. A request arriving from one country while asking for another country's price list gets a 403 on several of my hosts, and both halves have to line up.
Country selection is the one place where address type matters directly. I keep addresses I run collection work through in the countries my targets actually serve, 5 or 6 of them at a time, so a region check is a matter of switching an exit in the worker config and rerunning the same URL.
Matching the exit country brought the run to 7.4 percent.
Source four: the exit address carries a history of its own
Now we reach the source everyone suspects first and almost nobody confirms properly.
The sign is a difference between two addresses under identical conditions. Same URL, same headers, same cookie jar, same second, one address returns 200 and another returns 403. Nothing in the request changed. The response is usually small, arrives quickly, and stays consistent for that address across many paths and many hours.
The probe has to be tight, because a loose version of it produces false answers. Both requests go out inside the same second, with the same header set, and with a jar that was issued to each address separately. I run 6 addresses against one URL and read the pattern across the group.
for A in $(cat exits.txt); do
  code=$(curl -s -o /dev/null -w '%{http_code}' --max-time 20 \
         -x "socks5h://user:pass@$A" -H "$UA" 'https://target.example/catalog/drills/')
  printf '%-24s %s\n' "$A" "$code"
done   # six exits, one URL, one pass, run inside a single minute
Two patterns come out of that table and they mean different things. Scattered results, where two addresses out of 6 answer 403 while the rest answer 200, point at the individual address and its own record. A whole group failing together, where all addresses inside one /24 answer 403 while addresses from another network answer 200, points at a range-level rule, and swapping to a neighbouring address inside the same block will not move anything.
The repair follows the pattern. For individual addresses I replace the address and keep a spare on hand, which is why my pool always holds 2 more addresses than the crawler uses. For a range-level rule I move to a different network entirely.
What makes this workable is knowing what stands behind an address. I run private exits with a single user behind them, so the record attached to any address is my own traffic and nothing else, and a replacement address starts from a record I can predict. That is also why my repairs stay reproducible: when I change an address and the 403 disappears, the address was the variable, and no other tenant's activity sits in the way of that conclusion.
The same logic covers the hardware side. My exits are server addresses running on owned hardware, which gives every address a stable identity, a fixed network and a known route, so the address I tested at midnight behaves the same at 6 in the morning. Stability is what turns an A/B test into evidence.
Handling address history took me from 7.4 percent to 3.4 percent.
Source five: a protection layer answers before the site does
Some 403 responses never reach the application at all, and those have a shape you learn to recognise quickly.
The sign is the body. Four kilobytes and up, script tags inside, a reference identifier printed at the bottom, sometimes a meta refresh, sometimes a challenge form. Headers name the vendor: CF-Ray, X-Amz-Cf-Id, an Akamai reference, a Server field carrying a proxy name. The same URL in a real browser on the same address loads normally, and that contrast is the strongest evidence available.
The probe compares clients on one address. Fetch with your library client, fetch with a browser-grade client, keep the address and the headers identical. When the browser-grade client returns 200 and the library returns 403, the layer is reading something below the header line: the TLS handshake, the cipher order, the HTTP/2 settings frame, the ALPN list.
 # same exit, same URL, two clients: the difference lives below the headers
curl -s -o /dev/null -w 'plain curl: %{http_code}\n' \
  -x "socks5h://user:pass@$ADDR:$PORT" 'https://target.example/catalog/drills/'
curl_chrome116 -s -o /dev/null -w 'browser TLS: %{http_code}\n' \
  -x "socks5h://user:pass@$ADDR:$PORT" 'https://target.example/catalog/drills/'
Three repairs work on this source, in rising order of cost. A client that presents a browser handshake handles the majority of hosts and costs nothing at runtime, and on my set that alone converted 7 hosts out of 9 in this category. Keeping connections alive helps, because a layer that sees one connection per request from a client claiming to be a browser has a discrepancy to act on. For the last stubborn hosts I run the entry point in a real browser, collect the clearance cookie, and hand it to the fast client for the rest of the session, which keeps browser cost to one page per hour of work.
Transport matters here as well. I connect through a SOCKS5 endpoint for the crawler because the tunnel passes the TLS handshake through untouched, so the fingerprint that arrives at the target is exactly the one my client produced. That property is what makes the browser-grade client repair reliable: whatever handshake I build is the handshake the layer measures.
Source six: the endpoint wants authorization
API paths follow their own rules, and mixing them up with page rules wastes days.
The sign is the shape of the response. Content-Type is JSON, the body carries a code or message field with words like forbidden, scope or permission, and the 403 appears only on paths under /api/ while the HTML pages answer 200 from the same client. A WWW-Authenticate header may be present. The status split matters too: 401 says no credentials arrived, 403 says credentials arrived and are refused, which is a different repair entirely.
The probe is a token replay. Send the request with the token, then without it, then with a token you know is valid for a different scope. Three requests, three status codes, and the pattern names the problem.
curl -s -o /dev/null -w 'with token: %{http_code}\n' -H "authorization: Bearer $TOK" \
     -x "socks5h://user:pass@$ADDR:$PORT" 'https://target.example/api/v2/items?limit=50'
curl -s -o /dev/null -w 'no token:   %{http_code}\n' \
     -x "socks5h://user:pass@$ADDR:$PORT" 'https://target.example/api/v2/items?limit=50'
python - <<'PY'
import base64, json, os, time
p = os.environ['TOK'].split('.')[1]
c = json.loads(base64.urlsafe_b64decode(p + '=' * (-len(p) % 4)))
print('scopes:', c.get('scope'), 'expires in', int(c['exp'] - time.time()), 'seconds')
PY
Four causes account for everything I have seen on this source. An expired token, which the decode above catches in one line and which my worker now refreshes at 80 percent of the stated lifetime. A scope the key does not hold, where the account reads one endpoint and the crawler asks for another. A signed URL past its validity window, common on media and export links, where the signature holds for a few minutes and a queued download arrives late. A quota attached to the key, where the endpoint answers 403 after a daily count is reached and returns to normal the next day at the same hour.
That last one deserves a note, because it looks like an address problem and is not one. If the 403 follows the token across every address you own, the address is not involved at all. I spent half a day rotating exits on a host that was counting requests per key.
Source seven: the rate limit answers with 403
The last source is the one that costs the most time to identify, because it arrives late and looks like everything else.
The sign is timing. The first requests succeed, the 403 shows up after a certain count, and a pause of several minutes brings the host back. Retry-After sometimes appears. The count where it starts is repeatable, which is what confirms it: 240 requests on one of my hosts, 3 runs in a row, within 6 of each other every time.
The probe is a slow single-thread walk. One request every 2 seconds against a list of 400 URLs from one address, logging the index of the first 403. Then the same walk from a second address to confirm the counter belongs to the address and not to the whole job.
i=0
while read -r u; do
  i=$((i+1))
  c=$(curl -s -o /dev/null -w '%{http_code}' -x "socks5h://user:pass@$ADDR:$PORT" "$u")
  [ "$c" = "403" ] && { echo "first 403 at request $i"; break; }
  sleep 2
done < urls.txt
The repair has three dials and I set them in this order. Requests per minute per address comes first, because that is the number the host counts. Concurrency per host comes next: my collector now runs 3 threads per host against a shared token bucket, and the 8 workers that used to pace themselves separately all draw from that single counter. The width of the address list comes last, since spreading the same volume over more exits lowers the count each one produces while total throughput stays where I need it.
This is where rotation earns its place a second time. Running the listing walk across a pool aimed at parsing jobs with rotation on every request keeps the per-address count low while the nightly volume stays at 3000 URLs, and the pacing dial stops being the limit on how much I can collect.
Volume planning got easier once traffic stopped being a factor in the arithmetic. I work on exits with no meter on the traffic, so the pacing decision is about request counts per host and nothing else, and a retry storm on a bad night changes no part of my planning.
Inside my scheduler the same dials live in the tool config. For the jobs I run through the A-Parser profile I keep for this chain, the thread count, the delay between requests and the address list all sit in the task itself, so a host with a strict counter gets its own task with its own numbers and the other 41 hosts keep running at full speed.
A related status is worth separating here, since the two get confused constantly. Some hosts answer with 429 for the same condition, and the repairs overlap while the reading does not; I took that status apart in how to scrape data from Google Maps and business with the retry timing I settled on.
Pacing brought my run to 0.6 percent, which is close to where it sat before the trouble started.
The source table: sign, probe and repair in one place
Everything above, arranged so a sign in your log points at one row.
| Source | Sign in the response | Probe | Repair |
|---|---|---|---|
| Headers | 403 on first request from every address, body under 1 kB | replay the browser request, strip fields one at a time | full header set in browser order, HTTP/2, Referer chain |
| Cookie and session | root 200, deep path 403, Set-Cookie present | fetch root with a jar, refetch the path with it | warm-up sequence, jar per exit, refresh on a timer |
| Region | 403 on every path including the root, fast response | same URL from 4 exit countries within minutes | exit country matching the target, language and currency aligned |
| Address history | one exit 403, another 200, everything else identical | 6 exits against one URL inside a single minute | replace the address, or move to another network for a range rule |
| Protection layer | body over 4 kB with scripts, vendor header present | library client against a browser-grade client, one exit | browser handshake, keep-alive, browser entry for the session cookie |
| Authorization | JSON body with a code field, 403 only under /api/ | send with token, without token, decode the expiry | refresh before expiry, correct scope, respect the key quota |
| Rate limit | 403 after a repeatable request count, Retry-After sometimes | single thread, 1 request per 2 seconds, log the index | per-address pace, threads per host, wider address list |
Two rows in that table share a trap. Header problems and cookie problems both give a small 403 on a deep path, and the root URL is the only quick way to tell them apart. Region problems and address history both give a 403 that follows the exit, and the difference is whether every address in the country behaves the same way.
What the sequence cost and what it returned
Eleven days, six repairs, one crawler that now finishes its run. Here is where the time actually went.
| Stage | Days | 403 share after | What it settled |
|---|---|---|---|
| Response logging switched on | 1 | 31.0 percent | gave every later reading something to read |
| Header replay across 42 hosts | 2 | 19.0 percent | 21 hosts checked at least one header field |
| Cookie warm-up and jar per exit | 2 | 11.2 percent | 9 hosts issue state on the front page |
| Country sweep and exit matching | 1 | 7.4 percent | 4 hosts serve one region only |
| Address A/B across 6 exits | 2 | 3.4 percent | 2 addresses replaced, 1 network changed |
| Client handshake and browser entry | 2 | 3.4 percent | 9 hosts answered below the header line |
| Pace, threads and address width | 1 | 0.6 percent | 3 hosts count requests per address |
The first row is the one I would repeat in any position. One day of logging changed every reading that came after it, and without the body samples I would have spent the header days on address swaps.
The largest surprise was the fifth row producing so little movement in the headline number while fixing 9 hosts. Those hosts were a small share of my URL volume and a large share of my frustration, and a percentage across the whole run hides that entirely. I now track the 403 share per host as well as across the job, and the per-host view is where a single broken target shows up on the first night.
The dullest lesson holds the most value. Six of the seven sources are identified by comparing two requests that differ in exactly one field, and the discipline is in changing that one field and nothing else. My worst day of the 11 came from swapping the address and the header set together, reading the 200 that followed, and spending the next morning trying to work out which of the two had done it.
If you want the checking routine that sits under all of this, I wrote up the address probes separately in a walk through testing an address before you rely on it, covering the header leak test and the region check that feed straight into sources three and four above.