How many proxies do I need for a job: sizing by threads, volume and the window

Twice a month someone drops the same question into my work chat. How many addresses do I order for this. The message almost never carries a page count, a deadline or a target host, so the honest answer would be a shrug, and a shrug does not get anyone a working run.
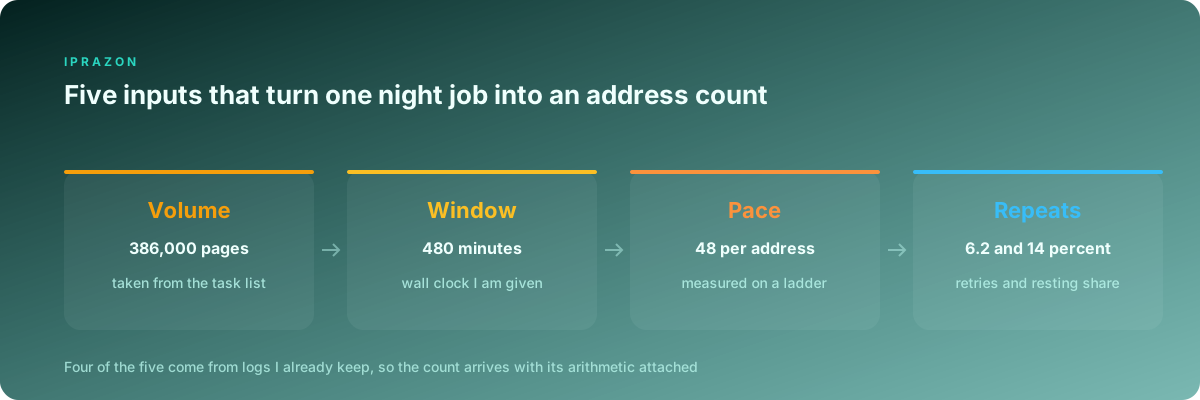
I keep collection infrastructure for a retail monitoring project and a set of long lived accounts on three platforms. Over the last few passes I stopped guessing and started writing the count out of four measured inputs. The arithmetic below is what I actually run before an order goes in, together with the numbers from three jobs of very different shape: a 45 minute price sweep, a 386,000 page catalogue walk across a night, and 96 profiles that have to stay recognisable for months.
The three numbers I write down before ordering anything
Volume, window, pace. Those three, in that order, and nothing gets ordered until all three exist as figures.
Volume is the count of requests the job has to complete, taken from the task list. For a catalogue that is the number of URLs in the sitemap slice I am collecting. For a rank capture it is keywords multiplied by regions multiplied by result pages. I count it exactly. A job described as "the whole catalogue" turned out to be 386,412 URLs when I finally exported the list, and my mental figure had been half of that.
Window is the wall clock the job is allowed to occupy. A price sweep for a morning report has 45 minutes because the report leaves at a fixed hour. A catalogue pass has the 8 hours between the evening freeze and the first office login. The window is the input people most often leave open, and an open window makes the count meaningless, since one address will finish anything given enough time.
Pace is the number of requests per minute a single address holds on one specific host without collecting refusals. This is the only input I have to measure, and it is the one that moves the answer most. The same pool of addresses gives me 210 requests a minute each against a price API and 22 a minute each against a search page on a retailer with an aggressive limiter.
There is a fourth input that only appears on account work: the number of identities the job carries. When it exists, it overrides the other three completely, and the section on the third job below shows why.
The ladder that gives me a pace per host
My pace measurement is a ladder with idle probes between the rungs. One address, one host, six minute rungs, and the request rate raised by a fixed step each rung. After every rung the address goes quiet for 11 minutes and then sends 5 slow requests as a probe. That probe is the part that changes the result.
#!/usr/bin/env bash
#-- one address, one host, six minute rungs with an idle probe between them
HOST="https://target.example"
PROXY="socks5h://node.example.net:1080"

for rpm in 12 24 36 48 60 72; do
  gap=$(awk -v r=$rpm 'BEGIN{printf "%.3f", 60/r}')
  echo "== rung $rpm/min, gap ${gap}s =="
  timeout 360 bash -c "
    while read -r u; do
      code=\$(curl -s -o /dev/null -w '%{http_code} %{time_starttransfer}' \
        -x $PROXY \"\$u\")
      echo \"\$code\"
      sleep $gap
    done < urls.txt" | awk '{n++; if($1>=400) bad++; t+=$2}
       END{printf "  refusals %.1f%%  first byte %.0f ms\n", 100*bad/n, 1000*t/n}'
  echo "  idle 11 min"; sleep 660
  for i in 1 2 3 4 5; do
    curl -s -o /dev/null -w "  probe %{http_code}\n" -x $PROXY "$HOST/"
    sleep 12
  done
done
Here is what that produced on the catalogue host, the one behind my night job.
| Rung | Requests a minute | Refusals inside the rung | Median first byte | Idle probe 11 minutes later |
|---|---|---|---|---|
| 1 | 12 | 0.0 percent | 288 ms | 5 of 5 answered 200 |
| 2 | 24 | 0.0 percent | 291 ms | 5 of 5 answered 200 |
| 3 | 36 | 0.0 percent | 303 ms | 5 of 5 answered 200 |
| 4 | 48 | 0.1 percent | 319 ms | 5 of 5 answered 200 |
| 5 | 60 | 0.2 percent | 402 ms | 429 for the next 6 minutes |
| 6 | 72 | 4.6 percent | 980 ms | 429 for the next 24 minutes |
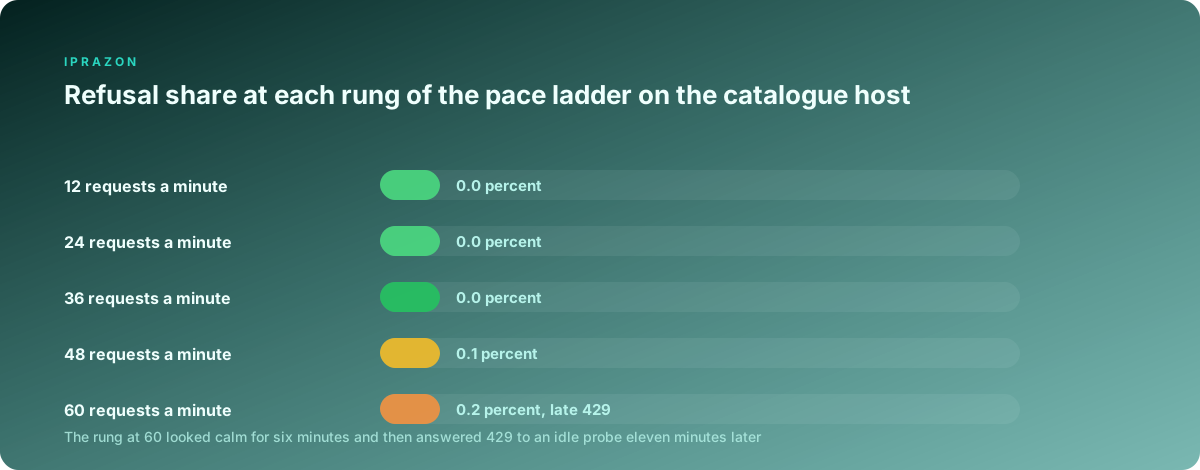
Read rung 5 carefully. During its six minutes the address returned 0.2 percent refusals and a first byte figure that looked survivable. A sweep that stopped there would have recorded 60 as the working pace. The probe eleven minutes later found the address locked out, and that lockout would have arrived in the middle of a night run with nobody watching.
So my working pace is the highest rung that satisfies both conditions at once: refusals under 0.5 percent inside the rung, and a probe that comes back with 200 on all five requests. On this host that is 48. First byte drift also stays under 15 percent at that rung, which is the third signal I record.
The ladder takes 108 minutes per host including the idle time. I run it once per host and keep the figure in a table that every job reads from.
| Host in my runs | Highest rung that held | Pace I run | First byte drift at that pace | Retry share on the last pass |
|---|---|---|---|---|
| Catalogue pages, retailer A | 48 | 48 | 11 percent | 2.4 percent |
| Search and filters, retailer B | 26 | 22 | 8 percent | 3.1 percent |
| Price API, partner C | 240 | 210 | 3 percent | 0.6 percent |
| Profile actions, platform D | 14 | 12 | 4 percent | 1.1 percent |
Retailer B gets a pace below its own ladder top because its limiter counts a sliding hour, and a rung only observes six minutes. On any host where the limiter window is longer than a rung I take one step down and add a long confirmation pass at that pace before the job goes live.
From pace to a count: the arithmetic I run
With volume, window and pace in hand the count follows from three corrections. Retries, resting addresses, and the pair I hold out of the run.
Retries are the requests that have to be sent twice. Timeouts, gateway errors, pages that come back with the price block missing. On my catalogue host that share sits at 6.2 percent across the last six passes, so the job carries 6.2 percent more requests than the URL list suggests.
Resting is the share of the pool that is unavailable at any given moment. An address that collected a refusal streak goes quiet for 20 minutes before it rejoins. Measured across a full night, 14 percent of my pool is in that state at any sampled minute.
The held pair is two addresses that never enter the run. They exist so I can reproduce a failure by hand while the job continues, and they answer the question of whether a bad response belongs to the host or to one particular exit.
import math

def addresses_for(volume, window_minutes, pace_per_address,
                  retry_share=0.062, resting_share=0.14, held_back=2):
    attempts    = volume * (1 + retry_share)
    needed_rate = attempts / window_minutes
    working     = needed_rate / pace_per_address
    with_rest   = working / (1 - resting_share)
    return {
        "attempts":    round(attempts),
        "needed_rate": round(needed_rate, 1),
        "working":     math.ceil(with_rest),
        "order":       math.ceil(with_rest) + held_back,
    }

print(addresses_for(386_000, 480, 48))
#=> {'attempts': 409932, 'needed_rate': 854.0, 'working': 21, 'order': 23}
Four lines of arithmetic and a number I can defend. When someone asks where 23 came from, the answer names the volume, the window, the measured pace and the two measured shares, and the conversation ends there.
The retry and resting shares are the two figures worth keeping fresh. Both come out of the previous pass, both drift when a host changes its protection, and both are cheap to recompute from a log I already keep.
Threads per address come out of the pace
The phrase people search for is proxies per thread, and the ratio it implies runs backwards. Threads are the output here. Pace and response time set them.
One thread sends one request, waits for the answer, sends the next. So a single thread against a host with a 1.9 second median response delivers about 31 requests a minute. If the measured safe pace is 48, one thread cannot reach it, and I need 2 threads per address with a gap after each response to hold the pace where I measured it.
threads per address = ceil(pace * median_response_seconds / 60)
gap after response = threads * median_response - 60 / pace| Job | Median response | Pace per address | Threads per address | Gap after each response |
|---|---|---|---|---|
| Price points, retailer B | 0.74 s | 22 | 1 | 2.0 s |
| Catalogue pages, retailer A | 1.9 s | 48 | 2 | 1.1 s |
| Price API, partner C | 0.21 s | 210 | 1 | 0.08 s |
| Profile actions, platform D | 2.4 s | 12 | 1 | 2.6 s |
Three of those four jobs run one thread per address with an enforced gap. That surprises people who expect a thread count in the dozens per address. On a host with a real limiter the pace ceiling arrives long before the concurrency ceiling does, so the gap is doing the work and the second thread would only spend the same quota faster.
Partner C shows the opposite shape. A pace of 210 a minute with a 0.21 second response means one thread saturates it with room left over, and the whole integration runs on 3 addresses while a catalogue job on the same collector box needs 23. Same hardware, same IPv4 addresses ordered by the count I measured, completely different arithmetic.
Total threads for a job is the per address figure multiplied by the working count. My night run is 21 addresses at 2 threads, so 42 threads on the collector, and the collector box was sized against that figure. The number came out of the arithmetic before anyone typed it into a config.
Job one: 12,400 price points inside a 45 minute window
The morning report needs current prices for 12,400 items across retailer B before the report goes out. Window 45 minutes, hard.
Volume 12,400, window 45, pace 22. Attempts come to 13,169, so the run has to hold 293 requests a minute. Divide by the pace and I need 13.3 addresses of pure throughput. Correct for the resting share and it becomes 16. Add the held pair and the order is 18.
The run finished in 37 minutes with 8 minutes of the window unused, and that spare time is deliberate. A morning job that finishes exactly at the deadline has no room for the one host hiccup that always happens on the pass you cannot repeat.
Two details from this job that the arithmetic alone would miss. First, the price block on retailer B sits behind a search page, so 2,100 of the 12,400 items need two requests each, which pushed real volume to 14,500 and would have blown the window if I had counted URLs from the list only. Now I count requests, and the difference between those two counts is written into the task record.
Second, the run holds a fixed exit per item family so that repeated checks on the same item come from the same place, which keeps the price history consistent when a host serves regional variants. Those sweeps sit on private IPv4 addresses for parallel collectors, assigned to families at the start of the pass and released at the end.
Job two: 386,000 catalogue pages across a night window
This is the job the arithmetic above was built for. 386,000 URLs, 8 hours between the evening data freeze and the morning login, retailer A with a measured pace of 48.
The calculator returns 21 working addresses plus 2 held, 42 threads, 854 requests a minute. Actual delivery on the last pass was 857 a minute averaged over the night, and the list closed at 7 hours 58 minutes with 15 addresses never touching a refusal at all.
Getting to that figure took three passes with the wrong count first. The pass on 12 addresses is the one worth describing, because everything about it looked like a host problem and none of it was.
With 12 addresses the run still demanded its 854 pages a minute, which works out to 71 requests a minute per address against a measured ceiling of 48. Refusals climbed to 4.1 percent, retries multiplied the volume by another 12 percent, and effective delivery collapsed to 470 pages a minute. The window closed with 47 percent of the list uncollected, and my first instinct was to blame the retailer for tightening its limiter overnight.
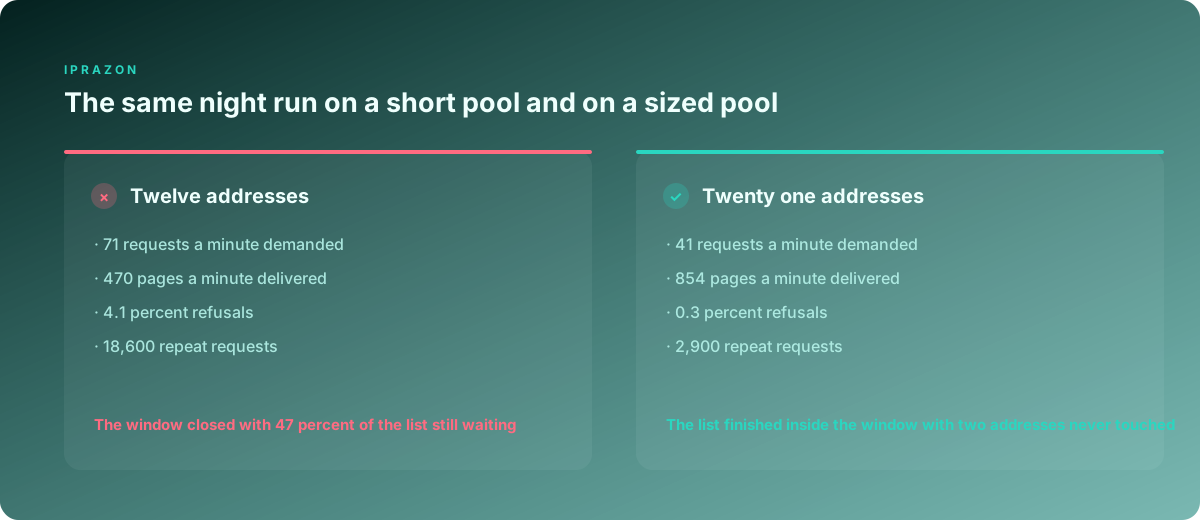
The limiter had not moved. Here is the same run demanded from pools of different size, all other settings identical.
| Addresses in the run | Pace demanded per address | Pages a minute delivered | Refusal share | Wall clock for the list |
|---|---|---|---|---|
| 8 | 107 | 316 | 9.4 percent | 21 h 37 m, aborted |
| 12 | 71 | 470 | 4.1 percent | 14 h 32 m |
| 17 | 50 | 690 | 1.2 percent | 9 h 54 m |
| 21 | 41 | 854 | 0.3 percent | 8 h 00 m |
| 34 | 25 | 861 | 0.2 percent | 7 h 56 m |
The shape of that table is the whole argument for measuring. Between 8 and 21 addresses the delivered rate rises faster than the address count, because every address below the ceiling spends its quota on pages that come back with content, and every address above it spends part of the quota on refusals that still cost a round trip.
Between 21 and 34 the curve flattens, since the target host now sets the pace and the pool has capacity to spare. Those spare addresses are far from idle in my setup, and the section below says where they go.
The catalogue pass runs through datacenter addresses on owned hardware because the pace figure only stays meaningful when node capacity is predictable across the whole night. A pace of 48 measured at 9 in the evening has to still be 48 at 4 in the morning, otherwise every calculation above rests on sand.
Job three: 96 profiles, where identities set the count
The third job breaks the formula on purpose, and this is the distinction people miss most often when they size a pool.
I keep 96 profiles on platform D. Each performs about 18 actions a day: log in, walk a feed, react to a few items, occasionally post. Total volume is 1,728 actions across a 10 hour window, which comes to 2.9 actions a minute. The measured pace for that platform is 12 a minute per address. Run the arithmetic and it asks for a single address.
One address for 96 profiles would put 96 identities behind one exit, and the platform would connect them within days. So the count comes from a different place entirely: one address per profile, held for as long as the profile lives. 96 plus 6 spare for replacements, which is 102.
| Question the job answers | Pace shaped job | Identity shaped job |
|---|---|---|
| What sets the count | volume divided by window divided by pace | number of identities that must stay separate |
| What an address carries | anonymous requests, interchangeable | one profile, one history, one set of cookies |
| How long an address is held | minutes, released at the end of the pass | months, released when the profile retires |
| What the spare capacity covers | retries and resting after refusals | replacements when a profile is retired |
| What a shortage looks like | a window that closes early | identities linked to each other |
The middle row is the one that matters. On the catalogue job an address is a slot with no memory, and any address in the pool can serve any URL. On the account job an address is part of the identity, alongside the fingerprint, the timezone and the browsing history, and swapping it is a visible event on the platform side.
That is why the profile work sits on one private address per profile with the same addresses rented by the month, so the exit under a profile stays constant across the whole life of that profile. The automation itself is scheduled work, and profile runs driven from ZennoPoster read the address assignment from the same table that holds the profile record, so a profile physically cannot start on the wrong exit.
Mixed jobs exist and they take both calculations. A project of mine walks a marketplace catalogue anonymously and then checks 40 seller dashboards from logged in sessions. The catalogue half gets 19 addresses from the volume arithmetic, the dashboard half gets 40 held addresses from the identity count, and they never share a single exit.
What a short pool does to a run, measured
I ran the 8 address pass to the end once, purely to have the numbers, and it produced the clearest lesson of the whole exercise.
Refusals were 9.4 percent, and every refusal cost a full round trip before it returned nothing. Retries pushed the attempted volume from 409,932 to 486,000. The average first byte time went from 319 ms to 1,240 ms as the host started delaying my requests before it started refusing them. Three of the 8 addresses spent more than a third of the night in cooldown, which meant the effective pool was closer to 5 for long stretches.
The compounding is what makes a short pool worse than the ratio suggests. Half the addresses gives less than half the throughput, since the missing capacity comes back as refusals, refusals come back as retries, retries raise the demanded pace on the addresses still working, and that raised pace produces the next round of refusals. My 8 address pass delivered 37 percent of what the 21 address pass delivered, on 38 percent of the addresses, with 2.4 times the traffic sent.
There is a second cost that never appears in a throughput chart. A run at 9.4 percent refusals leaves gaps in the data, and the gaps are not random. They cluster on the deep catalogue pages that arrive late in the pass, which are exactly the long tail items the project was built to watch. A pass at 0.3 percent refusals gives me a dataset I can compare against yesterday. A pass at 9.4 percent gives me a dataset that has to be re annotated by hand before anyone trusts a price change in it.
For the collector side I keep the run on a SOCKS5 endpoint for the collectors, since the same tunnel carries both plain document fetches and the small rendered subset, and one endpoint type across the run keeps the pace accounting honest.
Spare capacity and where I send it
A pool sized above the ceiling of one host is a pool with capacity available for the next task, and my schedule is built to use it.
The night catalogue pass needs 23. My standing pool is 34. The 11 addresses beyond the catalogue count are doing three things while the catalogue runs.
They cover host diversity. The project touches 9 hosts, and their pace ceilings differ by a factor of 10. When the catalogue job finishes at 4 in the morning, the same addresses roll straight into the rank capture that runs against a search engine at a far lower pace, and having 34 of them means that job finishes before the office opens too.
They cover the replacement cycle. Addresses get rotated out of an account project when a profile retires, and a spare in hand means a replacement takes minutes.
They cover the measurement itself. Every ladder I described above eats one address for 108 minutes per host. With spare capacity I re measure a host while production keeps running, and the numbers stay current without anyone waiting for a maintenance window.
There is one operational point worth stating plainly. A larger pool means each address carries a thinner slice of history, so per address logging has to be good enough to make a rare failure visible in a pool of 34. My run log writes the exit address into every row, and a nightly query groups refusals by address before it groups them by host. That query is 12 lines and it has found two genuinely degraded exits in six months, both replaced the same day.
For jobs where the exit is meant to change constantly, I run the collectors through an endpoint that rotates on every request and count the arithmetic on concurrent sessions, which suits list collection across many domains where nothing has to be held. Jobs where a pass must stay attributable to specific exits keep a fixed assignment, and addresses set aside for scraping runs stay pinned for the length of the pass.
Re-measuring when the target moves
A pace figure has a shelf life. Mine last between two and five months, and the two things that end them are a protection change on the host and a change in what I request.
The signal I watch is the retry share on each pass. It sits at 2.4 percent on the catalogue host, and when a pass comes back at 4 percent or higher I put that host back on the ladder within the week. Three times out of four the ladder comes back with a lower top rung, and the address count for the next pass rises accordingly.
The second signal is the first byte drift inside a pass. A host that answers in 319 ms at the start and 700 ms at the three hour mark is telling me the pace is above what it wants to serve, even while the status codes stay at 200. I built a small alert on that: if the median first byte over a rolling 15 minute window exceeds the pass opening median by 60 percent, the run drops its pace by one rung on its own and writes a line into the log. It has fired 4 times, and each firing turned into a ladder re run that revised a pace figure downward.
I also re measure after any change on my own side. Adding a header set, switching a parser, moving from document fetches to a rendered pass, all of those change the median response time, and response time changes the threads per address even when the pace ceiling holds steady.
The habit that made this cheap is keeping one row per host with five columns: pace, threads per address, gap, retry share, resting share, and the date the row was measured. Every job reads that table and produces its count in a few seconds. Before that table existed I sized pools by feel, and a morning report went out with a third of its prices missing because the pool was short and nobody had checked the pace in months. Now the order arrives with its arithmetic attached, and the argument about whether the number is right happens against measurements that anyone on the team can reproduce.
Related pages on this site: a short formula for pool size and how rotating proxies work in practice.