
Rotating proxies: how the address switch works and which jobs it carries
One line in the config, thousands of exit addresses at the target. From the outside a rotating pool looks like something that needs explaining at length, and the mechanics of it fit on a single page.
I run price monitoring and search capture for a retail client. Nine target sites, 40,000 listing pages on a heavy day, 3000 keywords swept by region every week. Rotation carries most of that volume, and I have spent enough hours reading gateway logs to describe what the switch actually does. This piece goes mechanics first: where the address changes, what the session keeps while it changes, how the switch gets turned on in Python and in Selenium. Then the jobs, with the numbers my own run log produced.
Where the address changes on the way out
Your worker opens a connection to one host and one port. That entry point is fixed, it never changes, and your code holds it as a single string. Everything past that point belongs to the pool.
The gateway accepts the connection, authenticates it, then draws an exit address from the pool and opens the outbound connection from that address. The target site sees the exit. It has no view of the entry point, no view of your worker, and no view of the machine your crawler runs on.
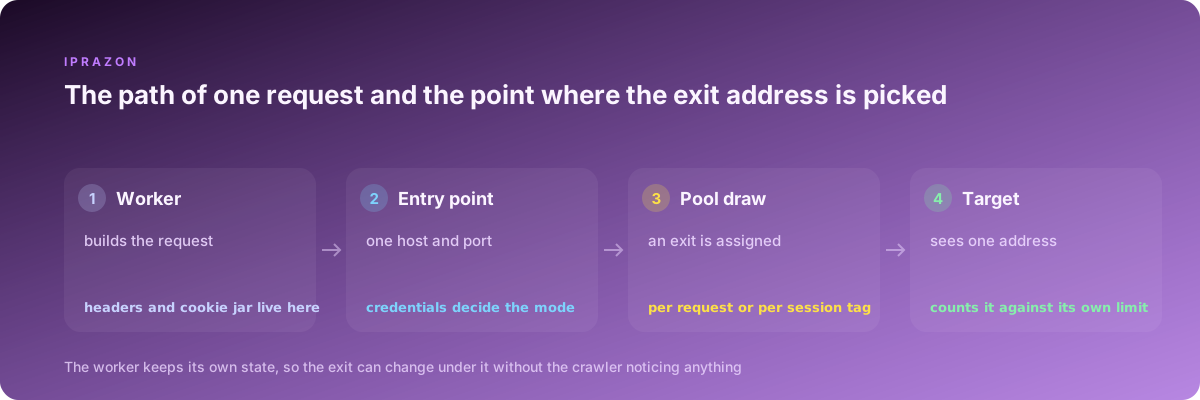
The draw is where the mode lives. Two behaviours cover almost everything I run:
Per request. Every outbound connection gets its own draw. Send 500 requests and the target counts 500 different sources, each with 1 request against it.
Per session tag. The credentials carry a label, and every request wearing that label leaves through the same exit until the label is dropped or the timer runs out. A rotating pool with one entry point for the whole run supports both from the same host and port, which matters more than it sounds: one endpoint in the config, mode chosen by what you put in the username field.
There is a third arrangement worth knowing because it behaves differently. The pool arrives as a list of address and port pairs, and the rotation happens in your code: the worker picks the next entry from the list before each request. The switch is yours to time, the exits are yours to name in a log, and any language with a proxy setting can do it in four lines.
I use both arrangements in the same project. Gateway rotation for volume work where I care about throughput and nothing else. A list for anything I need to trace afterwards, since a list gives me the exact address that served the page and the log becomes readable.
The three switch points, side by side
| Switch point | Who decides the exit | What the target counts | Where I run it |
|---|---|---|---|
| Gateway, per request | The pool | 1 request per address | Catalog walks, list collection, spot checks |
| Gateway, session tag | Your credentials | A run of requests per address | Multi-step flows, paging behind a form |
| Client-side list | Your code | Whatever your timing produces | Runs I need to trace address by address |
| Port mapping | The port number you dial | 1 address per port | Fixed worker to fixed exit assignments |
Port mapping deserves a line of its own. The pool exposes a range of ports on one host, and each port maps to a fixed exit. Dial port 10041 and you leave through the same address every time. I hand port ranges to workers by index, so worker 7 always dials port 10047, and when a target starts answering oddly I know which worker to look at within seconds.
What the session keeps while the exit changes
This is the part that gets described vaguely everywhere, so here is the concrete version.
Cookies live in your client. A requests.Session, a browser profile, a cookie jar file on disk: whichever you use, the jar sits on your side of the gateway and travels with the request. Draw a new exit and the cookie still goes out. Headers behave the same way. The user agent, the accept language, the referer chain, all of it is composed by your worker and none of it is touched by the switch.
TLS is per connection. Each new outbound connection performs its own handshake with the target, and a new exit means a new connection. Keep-alive pooling groups connections by exit, so a run of requests on one exit reuses a warm connection and saves the handshake time, roughly 90 to 140 ms per request in my measurements against European targets.
Anything the target ties to the address stays with the address. A rate counter, a per-address quota, a temporary hold after a burst: those live in the target's own bookkeeping, keyed by the source address. That property is what rotation sells. Give each request a fresh source and each request meets an empty counter.
So the choice between the two modes is a choice about where the state you need lives. State held in your code travels with you and rotation moves freely underneath it. State held by the target against a source address stays put when you pin the exit, and a session tag holds that same address for as long as the flow needs it. Both modes are ordinary working settings, and most of my projects use both inside one run.
Turning rotation on in Python
The plain case is three lines. One gateway string, one proxies dict, done.
import requests

GATE = "http://acc-rotate:pw@gate.example.net:9000"
PROXIES = {"http": GATE, "https": GATE}

for url in urls:
    r = requests.get(url, proxies=PROXIES, timeout=15)
    print(r.status_code, len(r.content))
Every call in that loop draws its own exit. Nothing else in the script changes, and this is the whole of what "how to rotate proxies in python" usually means in practice.
Session tags go in the username. The exact separator depends on the provider, and the shape is the same everywhere: a label that the gateway reads and maps to a held exit.
import requests

def gate(tag):
    return f"http://acc-session-{tag}:pw@gate.example.net:9000"

jars = {}

def fetch(url, tag):
    s = jars.get(tag)
    if s is None:
        s = jars[tag] = requests.Session()
        s.proxies = {"http": gate(tag), "https": gate(tag)}
    return s.get(url, timeout=15)

fetch("https://target.example/login", "w03")     # exit held for w03
fetch("https://target.example/orders?page=2", "w03")   # same exit, same cookies
Client-side rotation over a list takes about the same space. I keep the pool in a text file, shuffle it once at start, and walk it as a ring so the load spreads evenly across every address I own.
import random, requests
from itertools import cycle

POOL = [l.strip() for l in open("exits.txt") if l.strip()]
ring = cycle(random.sample(POOL, len(POOL)))   # shuffled once, then even

def get(url):
    p = next(ring)
    try:
        r = requests.get(url, proxies={"http": p, "https": p}, timeout=15)
        return p, r
    except requests.RequestException as e:
        return p, e          # the address comes back with the result, always
Returning the address alongside the result is a habit I picked up after a week of unreadable logs. When a run produces 3 percent oddities, the question is always which exits produced them, and a log line without the address answers nothing.
For threaded work, one Session per thread with its own gateway string keeps the connection pools separate. Sharing a single Session across 40 threads works, and it also puts every thread on the same keep-alive pool, which quietly reduces how often the switch happens. I bind a session to a thread with threading.local() and the throughput goes up by about a fifth on a catalog walk.
import threading, requests
tl = threading.local()

def session():
    if not hasattr(tl, "s"):
        tl.s = requests.Session()
        tl.s.proxies = {"http": GATE, "https": GATE}
    return tl.s
Async work follows the same pattern with aiohttp: the proxy goes into the request call, one connector per worker, and the gateway handles the rest. For the parsing side of these runs I take addresses prepared for parsing work so the pool arrives ready for the thread counts I actually use.
Rotation in Selenium and browser runs
A browser needs the address before it starts, since Chrome reads the proxy setting at launch and holds it for the life of the process. The bare form takes one argument.
from selenium import webdriver

opts = webdriver.ChromeOptions()
opts.add_argument("--proxy-server=socks5://gate.example.net:9050")
driver = webdriver.Chrome(options=opts)
That argument carries no credentials, which is the first thing everybody hits. Two ways around it, and I use both depending on the project. Authenticate by source address, so the gateway recognises the machine and asks for nothing else, which is what I do on servers with a fixed address. Or drive the proxy through selenium-wire, which accepts a full string with the login inside.
from seleniumwire import webdriver

opts = {"proxy": {
    "http": "http://acc-session-b12:pw@gate.example.net:9000",
    "https": "http://acc-session-b12:pw@gate.example.net:9000",
    "no_proxy": "localhost,127.0.0.1"}}
driver = webdriver.Chrome(seleniumwire_options=opts)
Rotation in a browser run happens per process. New driver, new session tag, new exit, and the whole browser profile goes with it. I run browser work in batches: 12 drivers up at once, each with its own tag and its own profile directory, each taking tasks from a queue until the batch retires and the next 12 start with fresh tags. Over a night that gives roughly 260 distinct exits on a job that never opens a login form.
A SOCKS5 endpoint fits browser work particularly well, since it carries the raw socket and leaves DNS to the far side when you dial socks5h. I hand a SOCKS5 endpoint to every browser worker for exactly that reason, and the name lookups then happen at the exit, which keeps the resolver picture consistent with the address the target sees.
Threads, limits and what the run log showed
Rotation earns its place in throughput, so here are the numbers off the same target, the same parser, the same weekday.
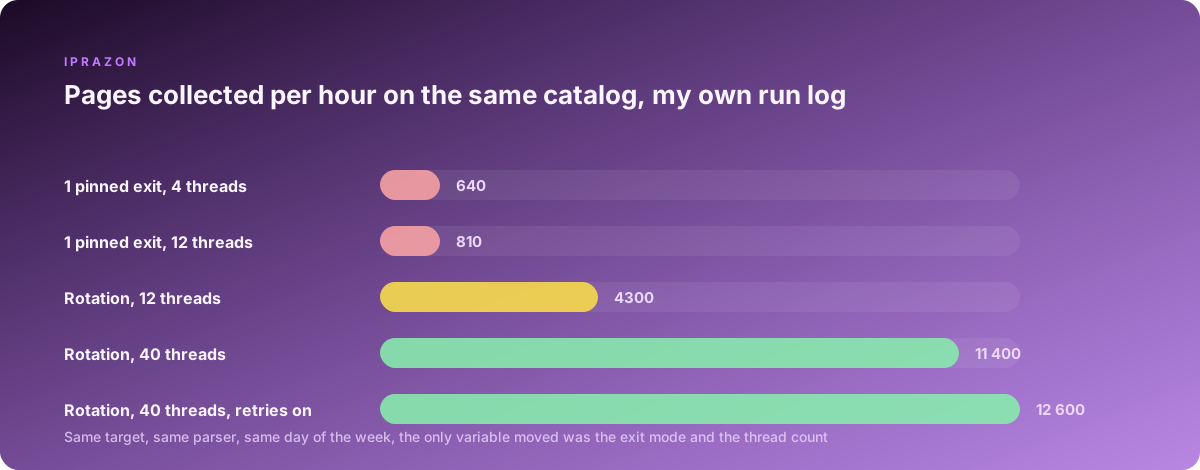
| Mode | Threads | Pages per hour | 200-code share | What limited it |
|---|---|---|---|---|
| One pinned exit | 4 | 640 | 99 percent | The target's per-address pace |
| One pinned exit | 12 | 810 | 71 percent | Per-address quota, 429s from minute 6 |
| Rotation per request | 12 | 4300 | 98 percent | My own parser speed |
| Rotation per request | 40 | 11 400 | 96 percent | Target latency at the tail |
| Rotation per request, retries on | 40 | 12 600 | 99 percent | Nothing I could see in the logs |
Row two is the interesting one. Going from 4 threads to 12 on a single exit lifted the hourly count by 27 percent and dropped the success share to 71 percent, because the target's counter for that source filled up in minute 6 and started answering 429 for the rest of the hour. The same 12 threads with a fresh exit per request produced 4300 pages at a 98 percent success share, since each request arrived at a counter with nothing in it.
At 40 threads the parser stopped being the limit and the target's own tail latency took over. That is a good place to be, because the fix from there is more workers, and the pool takes them. Traffic volume never entered the arithmetic, since I work on a pool with no cap on traffic volume and page weight on this target runs 240 to 900 KB.
One more number from the same log. Retries pushed 11 400 up to 12 600, an 11 percent gain, and every retried request went out on a new draw. A retry that leaves through a fresh address is a genuinely new attempt, which is why the retry policy and the rotation mode belong in the same conversation.
The jobs rotation carries
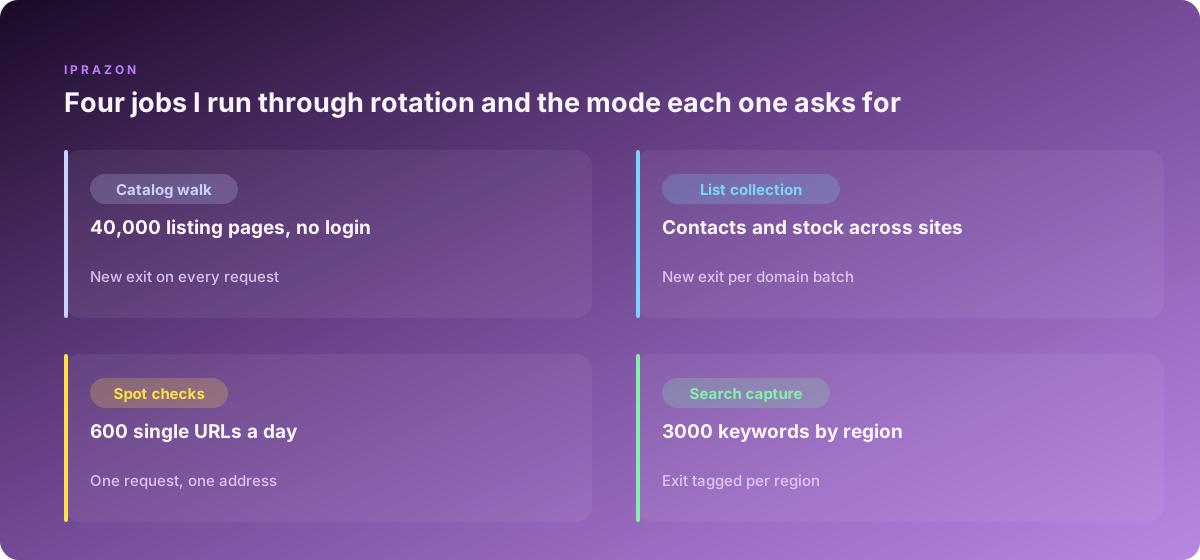
Walking a catalog. Public listing pages, no login, no cart, nothing the site holds against a session. This is where rotation that draws a new exit on every request does its plainest work. My heaviest target has 41,600 product pages across 380 categories, and a full walk takes 3 hours 20 minutes at 40 threads. The same walk on a single exit ran for two nights and finished at 62 percent coverage.
Collecting lists across many sites. Contact pages, stock states, delivery terms, gathered from 90 to 120 domains in one job. Each domain keeps its own counters, so I group requests by domain and give each group a short-lived tag, which puts 8 to 15 requests on one exit and then moves on. Throughput on this shape sits at 2400 pages an hour and the failure share holds under 2 percent.
Spot checks. Around 600 single URLs a day: a price on a product card, an availability flag, a page that should have gone live this morning. One request, one address, no continuity needed at all. These run through the same gateway with a plain per-request draw, and the whole batch takes 4 minutes.
Search capture. Region-tagged sweeps across 3000 keywords, where the region of the exit changes what comes back. I tag the exit by region, hold it for the length of one keyword group, and rotate between groups. Where the run goes through a job set up in A-Parser, the proxy list and the rotation interval sit in the task settings, so the tool handles the draw and my job is picking the interval.
Across those four shapes the common thread is arithmetic. A target that tolerates 1 request per second from one source will tolerate 40 in the same second from 40 sources, and every one of them meets a counter at zero.
Combining modes inside one project
Most real jobs contain more than one shape, and the sensible build assigns a mode per stage.
Take the price monitor. Stage one is a login on a partner portal that shows contract prices, which needs a held exit for the length of the visit: session tag on, one exit, cookies collected, 40 pages read behind the form. Stage two is the public catalog on the same site, 9000 pages, no account involved, per-request draw at 24 threads. Stage three is a verification pass over 200 sampled URLs, run 4 hours later from fresh draws to confirm the numbers are stable.
Three stages, two modes, one endpoint in the config. The switch between them is a username string, and my orchestrator writes it per stage:
MODES = {
    "portal":  "acc-session-{tag}",   # held exit for the whole visit
    "catalog": "acc-rotate",          # fresh exit per request
    "verify":  "acc-rotate",
}

def proxy_for(stage, tag="a1"):
    user = MODES[stage].format(tag=tag)
    return f"http://{user}:pw@gate.example.net:9000"
For the stages that hold an exit I like an address that belongs to my project alone, so I keep a dedicated IPv4 address for each held stage and let the rotating pool cover the volume stages. Both parts sit on server hardware the provider owns, which is why the latency numbers in the table above stay in the same band from run to run.
There is a second combination I use on tougher targets: rotation with a floor on session length. The draw happens per group of 5 to 8 requests, so the crawler picks up a page and its immediate children from one exit, then moves. Paging behaves better this way on sites that build the next page from a token on the previous one, and the throughput cost against pure per-request drawing was 6 percent on my last measurement.
Retries, backoff and honest failure counting
A rotating run needs a retry policy that understands the difference between a target saying "slow down" and a target saying "this page is gone".
import time, requests

BACKOFF = [2, 6, 15, 40]

def fetch(url):
    for wait in BACKOFF:
        try:
            r = requests.get(url, proxies=PROXIES, timeout=20)
        except requests.RequestException:
            time.sleep(wait); continue
        if r.status_code == 200:
            return r
        if r.status_code in (429, 503):
            time.sleep(wait); continue      # new draw on the next attempt
        if 400 <= r.status_code < 500:
            return None                      # gone, gone for good
    return None
Codes in the 400 range excluding 429 mean the page is missing or forbidden by content, and retrying those wastes attempts. Codes 429 and 503 mean pace, and every retry after a wait leaves through a fresh address, which is why my success share climbs to 99 percent with the policy switched on.
The counting part matters as much as the code. I log the exit, the code, the elapsed time and the attempt number for every request, then group by exit at the end of a run. On a healthy run the failure share sits within 1 percentage point across the whole pool. When one exit shows a materially different share, that is a target-side reaction to something specific, and I have the address in hand to check it.
Timeouts get their own bucket. A read timeout on a rotating run usually means the target got slow, and I set 20 seconds on catalog work and 45 on search capture, where responses are heavier. Counting timeouts as failures without separating them from 429s cost me half a day of chasing the wrong pattern on the search job.
Job, mode, and what the mode gives you
| Job | Exit mode | What the mode gives |
|---|---|---|
| Catalog walk, public pages | New draw per request | 41,600 pages in 3 h 20 m at 40 threads, 96 percent success |
| List collection across domains | Short tag per domain group | 8 to 15 requests per exit, failures under 2 percent |
| Spot checks on single URLs | New draw per request | 600 checks in 4 minutes, no state to carry |
| Search capture by region | Tag held per keyword group | Region-consistent results across 3000 keywords |
| Paging that carries a token | Draw every 5 to 8 requests | Paging continuity at a 6 percent throughput cost |
| Login and read behind a form | Session tag for the visit | One exit for 40 pages, cookies intact end to end |
| Retry after a pace code | New draw on each attempt | Success share from 96 to 99 percent |
| Long-lived account work | Dedicated address, held | Stable source for the life of the profile |
Read that table as a menu of settings on one endpoint. The mode is chosen per stage, the change costs one string in the credentials, and a project of any size ends up using several of the rows above in the same night.
What I would tell anyone starting: measure the target's per-address pace first. Send requests from one exit at a rising rate and record the point where 429 appears. Mine came at 1.4 requests per second on the heavy target and 0.6 on a smaller one with a stricter counter. That single number tells you how many exits a given throughput needs, and every setting after it follows from arithmetic.
Two neighbouring pieces go deeper on the parts I only touched here. On the monitoring job itself, sOCKS5 proxy covers the target-side pacing in detail. On sizing, how many addresses a given thread count actually needs works the arithmetic through with the same run log I quoted above.