
Proxy speed test: how to measure every stage of a request and find what actually moves it

Every few weeks someone sends me the same message: the proxy is slow. I ask for a number and get a feeling. Then I ask them to run one command, and in nine cases out of ten the address turns out to be sitting idle for 80 percent of the wait while the target site takes its time building a page nobody asked to be that heavy.
I run scraping infrastructure for a price comparison project: a few hundred catalogue pages a minute, a pool of datacenter addresses, and a dashboard that has taught me to stop trusting the word "slow". Below is how I split a single request into stages, what each stage costs on my own runs, and how to measure each one separately so the argument ends with a figure. All numbers here come from my own timing logs, taken on my own hardware, against sites I actually collect from.
The bench everything gets measured against
Before any comparison I fix the conditions, otherwise the numbers drift and mean nothing. My bench is 400 product pages from one retail catalogue, requested one at a time with no parallelism, over a night window when the site is quiet. One address, one target host, one client machine. I take the median, since a couple of stalled requests will drag an average anywhere they like.
The tool is curl with a timing format. Nothing else reports the internal stages of a request as honestly, and it costs nothing to run on any box.
cat > fmt.txt <<'EOF'
dns      %{time_namelookup}
connect  %{time_connect}
tunnel   %{time_pretransfer}
tls      %{time_appconnect}
firstbyte %{time_starttransfer}
total    %{time_total}
size     %{size_download}
EOF

curl -s -o /dev/null -w "@fmt.txt" \
  -x http://user:pass@node.example.net:8000 \
  https://target.example/catalog/item/8841
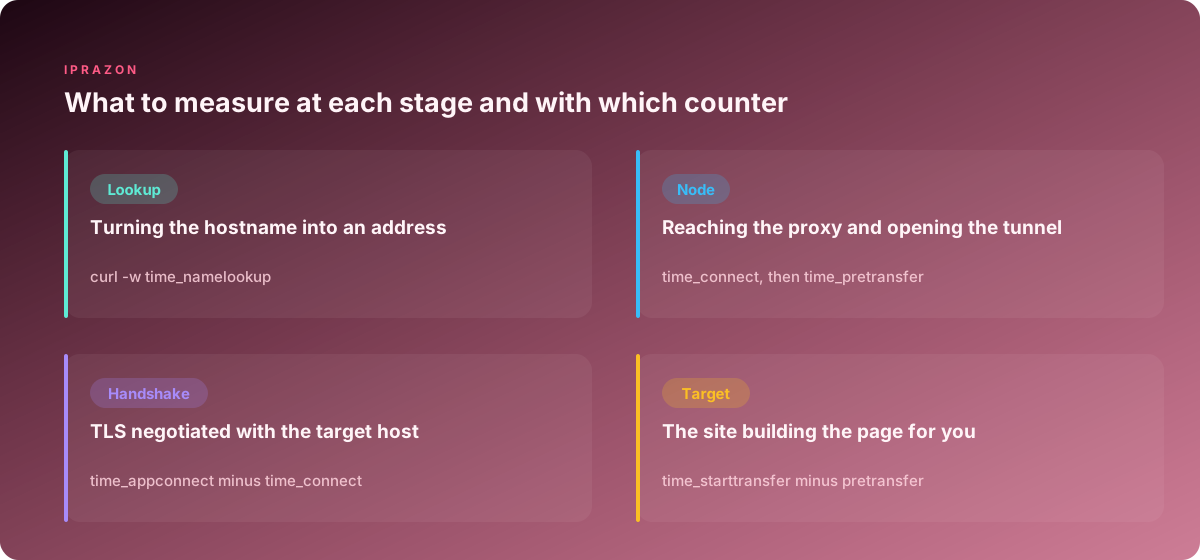
Those counters are cumulative, each one measured from the start of the request. To get the cost of a single stage you subtract the previous counter from the current one. That subtraction is the entire method, and it is the part most people skip before declaring a proxy slow.
Here is what my bench produces on a working datacenter address, median of 400 requests.
| Stage | What happens in it | Median | Share of the wait |
|---|---|---|---|
| DNS lookup | the hostname turns into an address | 24 ms | 4 percent |
| TCP connect | my client reaches the proxy node | 31 ms | 5 percent |
| Tunnel and auth | CONNECT accepted, credentials checked | 28 ms | 5 percent |
| TLS handshake | keys negotiated with the target host | 96 ms | 16 percent |
| Waiting for the first byte | the site assembles the page | 340 ms | 56 percent |
| Document transfer | 118 KB of HTML arrive | 88 ms | 14 percent |
| Whole request | end to end | 607 ms | 100 percent |
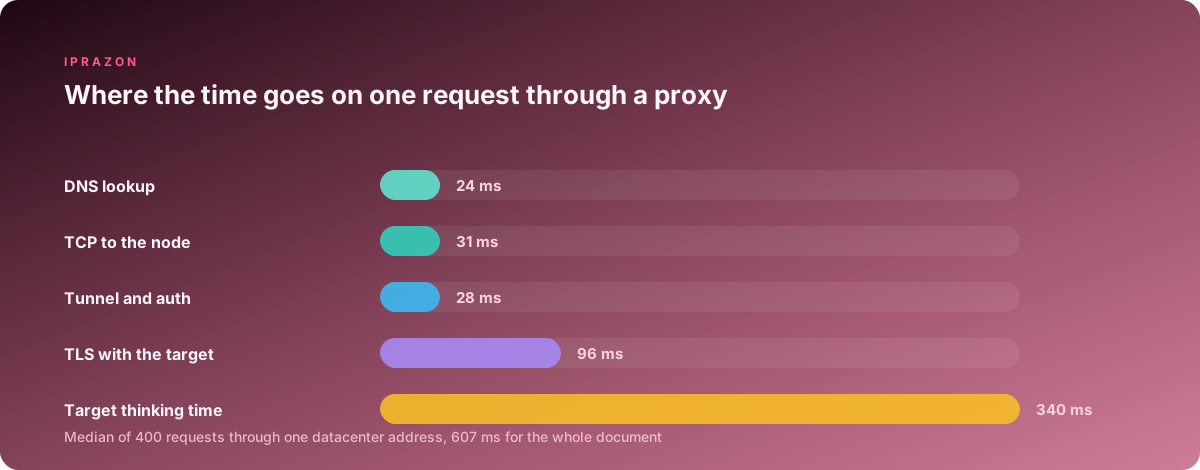
Look at the two rows that matter. The proxy node itself accounts for 59 ms of a 607 ms wait, under a tenth. The target site accounts for 340 ms. Every conversation about proxy speed should start from that ratio and usually starts somewhere else entirely.
Name resolution, the stage nobody watches
DNS is the first thing that happens and the first thing people forget exists. On my bench it costs 24 ms, which sounds harmless until you multiply it by a run of 40,000 pages and discover you spent 16 minutes converting the same hostname into the same address over and over.
Measure it on its own with the first counter:
curl -s -o /dev/null -w "%{time_namelookup}\n" https://target.example/
dig +stats target.example | grep "Query time"
Two things move this number on my setups. The first is the resolver: a provider resolver on a loaded link gave me 60 to 90 ms, a local caching resolver on the scraping box brought it to 1 ms on repeat lookups. The second is where resolution happens. With an HTTP proxy and a CONNECT tunnel, the name goes to the node and the node resolves it, so your local cache never gets used. With SOCKS5 you choose: remote resolution keeps your resolver out of the picture, local resolution lets your cache do the work.
I run a SOCKS5 endpoint with local name resolution on the price runs for exactly that reason, with dnsmasq caching in front of it. The lookup stage went from 24 ms to under 2 ms across the run, and the change took twenty minutes to make.
One caution from my own logs. If you cache aggressively and the target rotates its edge addresses, you can end up pinned to a slow edge node for hours. I cap the cache at 300 seconds and have never had a reason to go higher.
Reaching the node: the connect and the tunnel
This is the one stage that genuinely belongs to the address you bought. A TCP handshake to the node, three packets, and the counter is time_connect.
On my bench it costs 31 ms. That figure is geography plus node load, nothing more. From my Frankfurt box to a Frankfurt node I see 3 to 6 ms. To a node in Singapore the same handshake costs 190 ms, and no amount of tuning will change physics.
Measure it in isolation, without any target site involved:
for i in $(seq 1 20); do
  curl -s -o /dev/null -w "%{time_connect}\n" \
    -x http://user:pass@node.example.net:8000 http://example.com/
done | sort -n | awk '{a[NR]=$1} END{print "median", a[int(NR/2)]}'
Twenty samples give me a stable median in about four seconds. What I look for is spread. A node with a 30 ms median and a 35 ms worst case is healthy. A node with a 30 ms median and a 400 ms worst case is oversubscribed, and that spread will show up in your run as random slow pages that look exactly like target throttling.
Node capacity is where the provider actually earns its keep. On datacenter addresses running on owned hardware the connect time held between 28 and 34 ms across a week of measurements at 200 threads. On a reseller pool I tested earlier the same measurement swung between 30 ms and 600 ms depending on the hour, which made every run unpredictable in a way I could never explain to the people reading my dashboards.
After the TCP handshake comes CONNECT, and after CONNECT comes credential verification. The cost of that pair sits between time_connect and time_pretransfer, and on my bench it comes to 28 ms.
That 28 ms breaks down further. About 9 ms of it is the round trip carrying the CONNECT request and the 200 response. The remaining 19 ms is the node checking who I am. Login and password verification against a database is measurably slower than an IP allowlist, which is why every long run of mine authorises by address.
curl -s -o /dev/null -w "pass-auth %{time_pretransfer}\n" \
  -x http://user:pass@node.example.net:8000 https://target.example/

curl -s -o /dev/null -w "allowlist %{time_pretransfer}\n" \
  -x http://node.example.net:8000 https://target.example/
The first form sends a login and password, the second relies on my collector address being allowlisted at the node. Run both twenty times and compare the medians.
Switching my collectors to allowlist authorisation moved the tunnel stage from 28 ms to 11 ms. Over 40,000 pages that saved 11 minutes of wall clock time, and it cost me one form submission with the source addresses of my three collector boxes.
There is a second effect here that took me longer to find. Some clients open a fresh tunnel for every single request, throwing away the connection between pages. With keep-alive enabled, stages one through four disappear entirely on requests two and onward. My bench request costs 607 ms cold and 428 ms warm, so a reused connection removes 179 ms without touching anything on the network.
The TLS handshake with the target host
The proxy passes bytes through the tunnel; TLS gets negotiated between your client and the target server. On my bench it costs 96 ms, the second largest slice after the site's own thinking time.
You get it by subtracting: time_appconnect minus time_connect, adjusted for the tunnel. Three things move it in my experience.
Protocol version comes first. A full TLS 1.2 handshake needs two round trips. TLS 1.3 needs one. On a link with 40 ms of latency that difference alone is 40 ms per connection, and it appears on every cold request in the run.
Certificate chain length comes second. A site serving a four certificate chain with an OCSP staple I have to fetch separately cost me 140 ms in handshakes. The same site behind a modern CDN with a stapled response costs 70 ms.
Session resumption comes third, and it is the one under your control. When my client stores TLS session tickets, the handshake on a repeat connection to the same host drops from 96 ms to 22 ms. Most HTTP libraries do this by default inside one session object and lose it the moment you build a fresh client per request.
openssl s_client -connect target.example:443 -tls1_3 </dev/null 2>/dev/null \
  | grep -E "Protocol|Cipher|Verify"
I run that once per new target host and write the result into the run config. Knowing that a host negotiates TLS 1.3 with a two certificate chain tells me the handshake floor for that host, and any measurement above the floor points at something I can fix.
Waiting for the first byte, where the majority of the wait lives
time_starttransfer minus time_pretransfer is the site thinking. On my bench that is 340 ms of a 607 ms request, and it has no relationship to the address I am connecting through.
The test that settles the argument takes one minute. Fetch the same page directly from the collector box with no proxy involved, then through the proxy, and compare the first byte counters.
direct=$(curl -s -o /dev/null -w "%{time_starttransfer}" https://target.example/catalog/item/8841)
viaproxy=$(curl -s -o /dev/null -w "%{time_starttransfer}" \
  -x http://node.example.net:8000 https://target.example/catalog/item/8841)
echo "direct $direct   proxy $viaproxy"
On my catalogue the direct figure is 0.31 s and the proxy figure is 0.34 s. The 30 ms gap is the node and the extra hop. The 310 ms underneath belongs to the site, and it stays there whichever address you connect from.
Four patterns show up in that number on the sites I collect. Search and filter pages are slower than product pages, often by a factor of three, because the database work is real. Pages with personalisation logic are slower for a fresh session with no cookies, which describes every request a collector makes. Cold cache pages, deep in a catalogue where no human has looked recently, cost me up to 2.4 s against 340 ms for popular items. And rate limiting frequently arrives as added latency long before it arrives as a status code, so a first byte figure that climbs steadily through a run is the site telling you to slow down.
That last pattern is worth watching in your logs, because it gives you warning. On one retailer my median first byte time went 340 ms, 520 ms, 900 ms, 1.8 s across twenty minutes, and the 429 responses started right after. Now I watch the trend and drop the rate when it climbs past 700 ms, which keeps addresses used for scraping runs out of the flagged bucket entirely.
Transfer time and the weight of the page
The final stage of a document request is the transfer, time_total minus time_starttransfer. Mine is 88 ms for 118 KB of HTML, which works out to roughly 13 Mbit/s of effective throughput on that connection.
Measure the two together, since a transfer time without a size figure tells you nothing:
curl -s -o /dev/null -w "size %{size_download}  speed %{speed_download}  transfer %{time_total}\n" \
  -H "Accept-Encoding: gzip, br" \
  -x http://node.example.net:8000 https://target.example/catalog/item/8841
The header in that command matters more than most people expect. I found one of my collectors sending requests with no Accept-Encoding, pulling 412 KB of uncompressed HTML per page against 118 KB compressed. Transfer time was 290 ms per page against 88 ms. One header line, added to a config file, cut 200 ms off every request in a run of 40,000 pages. That is over two hours recovered from a single line.
Bandwidth caps also live in this stage. On metered plans I have watched transfer times triple in the last third of a run as the throttle engaged, while the connect and handshake stages stayed flat. If your transfer stage degrades through a run while everything before it holds steady, look at the traffic counter first. My price runs sit on addresses with unlimited traffic so that this class of problem never enters the picture, and the transfer stage stays at 88 ms whether I am on page 100 or page 40,000.
Extra requests, the part people count as proxy time
Here is where the label "slow proxy" comes from most often. A document request on my bench takes 607 ms. Opening the same page in a headless browser takes 4.6 s. Same address, same node, same target host, same moment.

The difference is 73 extra requests. Fonts, three analytics scripts, a chat widget, a recommendation carousel that fires its own API call, product images at full resolution, and a video player library that loads on every page whether a video exists or not. Total weight 3.4 MB against 118 KB for the HTML I actually parse.
Every one of those 73 requests goes through the same tunnel and pays its own handshake and its own wait. The proxy is doing exactly what it did before, seventy four times over.
The measurement is straightforward. Run the browser with the network log on and count.
node render.js https://target.example/catalog/item/8841 \
  | jq '{requests: (.entries|length), bytes: ([.entries[].size]|add)}'
On my project the fix was to stop rendering pages I do not need rendered. Of the 400 pages on my bench, 348 carry every field I collect in the server rendered HTML. Only 52 build their price block in JavaScript. So the run splits: 348 pages go through plain document fetches at 607 ms each, and 52 go through the browser at 4.6 s each. The full pass dropped from 30 minutes to 8.
Where rendering stays necessary, I block what I do not read. Images, fonts, media and analytics domains go into a blocklist in the browser config, and the page render falls from 4.6 s to 1.3 s. The price block still arrives because I let scripts from the site's own origin through.
For the rendered portion I keep profiles pinned to a private address per browser profile, since a rendered session carries cookies and a fingerprint that need to stay with one exit point across the whole pass.
Threads, and the point where parallelism turns into queueing
Everything above describes one request at a time. Real runs are parallel, and parallelism has a ceiling that shows up in the timing stages before it shows up in the error log.
My measurements on the same catalogue, one address, sequential warm-up excluded:
| Threads | Median request | First byte | Pages per minute | Errors |
|---|---|---|---|---|
| 10 | 601 ms | 336 ms | 620 | 0 |
| 20 | 607 ms | 340 ms | 1180 | 0 |
| 40 | 744 ms | 470 ms | 1900 | 0 |
| 60 | 1240 ms | 910 ms | 2100 | 4 |
| 120 | 3100 ms | 2700 ms | 1450 | 310 |
Read the first byte column. Up to 40 threads it barely moves, so the extra parallelism is genuinely free. At 60 the site starts holding my requests in a queue, and at 120 it holds most of them until they time out. Throughput peaked at 60 and then went backwards, which is the shape every rate limited target produces.
The mistake I made for months was running that ramp against a single address and concluding the address was the limit. It never was. The limit lived on the target side, counted per source address, so spreading the same 120 threads across 6 addresses at 20 threads each gave me 6800 pages a minute with zero errors. Same node, same bandwidth, same run. I keep a set of IPv4 addresses sized for parallel threads for that reason, and the thread count per address stays at 20 on this target regardless of how many addresses the pool holds.
Find your own ceiling with a ramp, and watch first byte time as the signal:
for t in 5 10 20 40 60 90; do
  echo -n "threads $t  "
  xargs -a urls.txt -P $t -I{} \
    curl -s -o /dev/null -w "%{time_starttransfer}\n" -x http://node:8000 {} \
    | sort -n | awk '{a[NR]=$1} END{printf "median %.3f\n", a[int(NR/2)]}'
done
The point where the median climbs by more than 30 percent over the previous step is your working ceiling for that target. Set the run one step below it. On my catalogue that means 20 threads per address, and I have never needed to revisit that figure on this site.
What my own client was costing me
One stage sits outside the network completely and I nearly missed it. After a run I compared the sum of my curl stage timings against the wall clock time of the collector, and the collector was 240 ms per page slower than the sum of its own network stages.
That gap was mine. HTML parsing with a heavy selector library took 140 ms per page. Writing each result to the database as a separate transaction took 80 ms. Logging every request body to disk took the rest.
Switching the parser to a streaming one brought parsing to 18 ms. Batching database writes in groups of 500 brought the write cost to under 1 ms per page. Logging went to bodies only on error. The collector now sits 22 ms above the network sum, and on a run of 40,000 pages that recovered nearly three hours.
Measure it the same way I did. Sum your stage timings, compare against the process wall clock, and the difference belongs to your code. For runs driven through a scheduler I check the same figure inside the tool, since runs built in A-Parser report per task timing that lines up with the curl stages closely enough to compare directly.
What the numbers looked like after each fix
Everything above came out of one week of measuring the same 400 pages and changing one thing at a time. Here is the ledger.
| Stage | Before | After | What moved it |
|---|---|---|---|
| DNS lookup | 24 ms | 2 ms | local caching resolver, 300 s cap |
| TCP connect | 31 ms | 31 ms | unchanged, geography sets this |
| Tunnel and auth | 28 ms | 11 ms | allowlist authorisation, no credentials |
| TLS handshake | 96 ms | 22 ms | session tickets reused across requests |
| First byte | 340 ms | 336 ms | unchanged, this belongs to the site |
| Transfer | 88 ms | 88 ms | compression header was already fixed |
| Client processing | 240 ms | 22 ms | streaming parser, batched writes |
| Per page total | 847 ms | 512 ms | seven measurements, four changes |
Of the 335 ms I recovered, 47 ms came from the network path and 288 ms came from configuration on my own boxes. The node I was blaming at the start of the week turned out to be responsible for 42 ms of an 847 ms wait.
The full pass tells the same story from a different angle. Before: 40,000 pages in 4 hours 12 minutes at 20 threads on one address. After: the same 40,000 pages in 41 minutes at 20 threads across 6 addresses, with the rendered subset cut from 400 pages to 52. Neither figure changed because the addresses got faster. They changed because I stopped asking the addresses to carry work that was never theirs.
If you take one habit from this, take the subtraction. Six counters, five subtractions, one line of output per request. Once the wait is split into stages, the question of which part to fix answers itself, and the answer is rarely the part you started out suspecting. My own pool sits on a datacenter pool with spare capacity precisely so that the 42 ms it contributes stays boring and predictable while I work on the 800 ms that belong to me.
Related pieces from this series: shadow ban check and how to fix 403 Forbidden when you collect data.