How to scrape Google search results without collecting blocks: from a keyword to a row in the report

Every Monday my desk produces one file: 3200 keywords, four cities, two engines with Google as the main one, three pages of depth each, one position per line. That comes out as 9400 separate fetch tasks and about five hours of wall clock time. The client reads the file at nine in the morning and never asks how it was made, which is the correct outcome.
The first version of this job took eleven days to stop lying to me. It finished, it reported success, and roughly a fifth of the positions in it were captured from a city nobody had asked about. No error appeared anywhere, because a results page answers with code 200 whether it holds the answer or something else entirely.
So this piece follows one keyword through the whole pass, stage by stage, in the order the work happens. Each stage ends with the check that closes it, and every figure comes off my own logs from the last four passes.
Why a results page behaves nothing like an ordinary page
A product page on a shop is a document. It sits at a URL, it has one body, and two visitors reading it get the same bytes with different prices at worst. A results page is assembled for the visitor at the moment of the request, and four inputs go into that assembly before any keyword is considered.
Region comes first. The engine reads the exit address, maps it to a city, and reorders the page around that city. My capture for one client covers four cities, and the same keyword produces a different first position in three of them.
Session history comes second. A visitor with cookies gets a page shaped by earlier queries, so a worker that reuses one cookie jar across 400 keywords is asking a progressively stranger question.
Layout comes third. Local packs, question boxes, video carousels and shopping rows push organic entries down the page, and a parser counting from the top of the body will hand you position 4 for something the engine considers position 1.
Pagination comes fourth, and it is the input people discover last. The second page is reached through a parameter that the engine treats as a hint, and a request for the third page can quietly return the second one again with a different token attached.
On top of those four sits the checking layer. A request that looks automated gets a page that carries a verification screen, and that page arrives with a success code, a plausible title and a body around 22 KB. My first pass wrote 1740 rows from pages like that before I looked at one of them in a browser.
| Input the engine reads | What changes on the page | What my task has to carry |
|---|---|---|
| Exit address and its city | ordering, local pack, currency of shopping rows | the city, pinned twice over |
| Cookies from earlier queries | personalised reordering, remembered filters | an empty jar per task |
| Declared language and layout | phone layout collapses several blocks | one layout for the whole pass |
| Page parameter and its token | depth, and whether page 3 repeats page 2 | the page number and the token seen |
| Request shape and pace | verification screen in place of results | a gap measured per address |
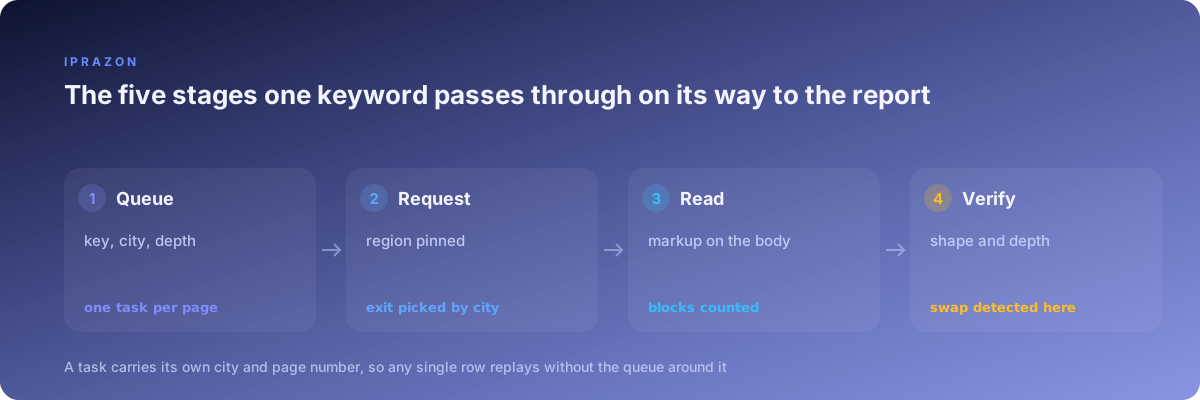
That table is the reason the queue looks the way it does. Every row in it turns into a field on the task.
Stage one: the queue, and what one task holds
A keyword list is source material. The queue is the thing that runs, and the two are different objects in my project. Building the second from the first takes eight lines and settles most of the pass.
One task equals one keyword, one city, one engine, one page number. That is the smallest unit that can succeed or fail on its own, and giving it its own identifier means any single row replays weeks later without rebuilding the queue around it.
import hashlib, itertools, json

KEYS   = [l.strip() for l in open("keys.txt", encoding="utf-8") if l.strip()]
CITIES = ["1002", "1017", "1074", "1093"]     # engine region codes
PAGES  = (0, 10, 20)                          # offsets, three pages deep

def task_id(key, city, engine, offset):
    raw = f"{engine}|{city}|{offset}|{key}".encode("utf-8")
    return hashlib.sha1(raw).hexdigest()[:12]

queue = []
for key, city, offset, engine in itertools.product(KEYS, CITIES, PAGES, ("a", "b")):
    queue.append({"id": task_id(key, city, engine, offset), "key": key,
                  "city": city, "offset": offset, "engine": engine,
                  "tries": 0, "state": "new"})

json.dump(queue, open("queue.json", "w", encoding="utf-8"))
print(len(queue), "tasks", len({t['id'] for t in queue}), "unique")
The two printed numbers should match. On my list they read 9600 and 9600, and the 200 tasks that disappear before the pass starts are keywords a client sent twice with different capitalisation, which the identifier collapses on its own.
Order matters as much as content. A queue sorted alphabetically sends 40 near identical keywords through one address in 90 seconds, which is a pattern no visitor produces. I shuffle inside each city group and interleave the groups, so a single address sees unrelated queries in a row and the whole pass spreads evenly across all four cities from the first minute.
Keyword lists arrive from the client in every shape a spreadsheet allows. I normalise them in a tool before they reach the queue, and keyword lists exported from Key Collector come out already deduplicated with the frequency column attached, which is what decides the depth each key deserves.
Depth is a per keyword decision on my project. High frequency commercial keys get three pages because the client tracks movement in and out of the top 20. Long queries with tiny frequency get one page, since a position past 10 on those has never once changed a decision. That split alone cut my pass from 12,800 tasks to 9600 without losing a single line the client reads.
Stage two: pinning the region so the page answers the right city
Region is where my early passes failed silently, so this stage now has three separate controls and a check that fires on every task.
The first control is the request parameter. Both engines I capture from accept a region code in the query string, and passing it is necessary work that solves about two thirds of the problem.
The second control is the exit address. An engine that receives a region parameter from an address sitting in another country treats the pair as a preference, and on one of my two engines the address wins whenever the two disagree. So the city groups in the queue map onto address groups, and a task for city 1074 leaves through an exit registered in that country.
The third control is the layout parameter that fixes language and result count, kept identical across the whole pass so two runs stay comparable.
The check is a control keyword per city. I keep four queries whose local answer I verified by hand, one per city, and every worker fires its control before the first real task of a block and again every 300 tasks.
CONTROL = {"1002": ("plumber near me", "Riverside Plumbing"),
           "1017": ("plumber near me", "Northgate Pipes"),
           "1074": ("plumber near me", "Sud Sanitaire"),
           "1093": ("plumber near me", "Hafen Klempner")}

def city_ok(html, city):
    key, expected = CONTROL[city]
    return expected.lower() in html.lower()
Crude, and it has never given me a false answer. When the control fails, the worker stops, the whole city group is paused, and nothing gets written. Before this check existed, a bad region setting cost me a full pass and a conversation I would rather have skipped. Now it costs 12 minutes.
The local pack is the part of the page that reveals region fastest, since it names actual businesses with actual addresses. A page can look regional in its shopping row and still be assembled for the wrong city, and the pack settles it in one string comparison.
Stage three: pagination, and where depth ends quietly
Page one is easy. Every problem in this job lives on pages two and three.
The offset parameter is read as a request, and the engine answers it when the answer exists. Ask for offset 20 on a keyword with 14 total results and you get the last page again, with a full body, a success code and rows you already have. A worker with no memory writes those rows a second time and the report shows a keyword occupying two positions.
Three guards handle it. The first is a hash of the result URL list per task: two consecutive pages producing the same hash means depth has ended, the task is marked complete, and the remaining pages for that keyword are dropped from the queue.
The second guard is the continuation token. Both engines expose something in the markup that says whether a next page exists, and reading it costs one selector.
The third guard is a hard ceiling. Three pages, always, even when the token says more exists. A capture that follows tokens until they run out turned one keyword into 47 tasks on my second pass and swallowed 20 minutes of the window on a query nobody tracks past the top 30.
def page_signature(urls):
    return hashlib.sha1("|".join(urls[:10]).encode("utf-8")).hexdigest()[:10]

seen = {}
def depth_done(key_id, urls, has_next):
    sig = page_signature(urls)
    repeated = seen.get(key_id) == sig
    seen[key_id] = sig
    return repeated or not has_next
The numbers from my last pass: 3200 keywords, 9600 planned tasks, 8830 actually fetched. The 770 skipped tasks are keywords whose depth ended before page three, and skipping them saved 34 minutes and 770 requests that would have collected duplicate rows.
Depth interacts with pacing in a way worth stating plainly. Pages two and three of the same keyword arriving back to back from one address is the most recognisable pattern in this whole job, since a real visitor who reaches page three took time getting there. I put the pages of one keyword into different blocks of the queue, separated by at least 40 other tasks, and my verification screens on deep pages dropped by roughly two thirds after that single change.
Stage four: the addresses underneath the queue
Nine thousand results pages an evening is a volume no single exit carries, and the engines count by address before they count by anything else. My working setup is 16 addresses split across 5 network ranges, grouped four to a city.
The subnet spread does more work than the count. On my first attempt I ran 12 addresses that all sat inside one contiguous range, and when one of them started collecting verification screens the other 11 followed within seven minutes. Ranges that sit apart from each other keep an incident local, and a paused address leaves the rest of the pass collecting. I take addresses prepared for results page capture with the range split written into the order, and the capture config carries one line per range so I can see the shape at a glance.
Exclusivity matters here for a specific reason. An engine remembers an address, and history it collected from somebody else last week arrives with my first request. Two addresses I once tested were already producing verification screens on task number three, which is the signature of an exit that spent its allowance before I ever touched it. Since moving the capture onto exits that carry a weekly rank pass with no shared history behind them, my cold start rate has been zero across four consecutive passes.
For the city groups that stay pinned all evening, the address holds for the whole block so cookies, language and the region setting stay consistent from the first task to the last. For the long tail keywords, where every task stands alone and nothing needs to survive between requests, changing the exit every few tasks does the spreading and my code holds one connection string. Both modes run in the same pass, one per queue segment, and the segment decides which one applies.
Protocol is a small choice with real consequences on this job. My workers speak a SOCKS5 endpoint the capture keeps open, which keeps hostname resolution at the exit and keeps the region consistent with the address the engine sees. Resolving locally and connecting remotely produces a mismatch that some checking layers read directly.
Two more properties earn their place. Results pages are heavy, my four passes a month pull between 260 and 380 GB, and traffic that goes unmetered on heavy passes means a Thursday re-run of a broken city group is a decision about time alone. And because rank capture compares this week against last week, the exits need to behave the same in both, so I keep the job on datacenter addresses grouped by country and the country grouping stays fixed for the life of the project.
| Queue segment | How the address behaves | Why that fits this segment |
|---|---|---|
| Commercial keys, city groups | one exit per group for the whole block | cookies, language and region stay identical across the block |
| Long tail, one page deep | exit changes every few tasks | every task stands alone, nothing has to survive between them |
| Control keywords | the exit that group is using right now | the control has to measure the same path the real tasks take |
| Repeat run for gaps | a different exit from the same country group | a second reading from a second address confirms the first |
Stage five: the pace one address holds all evening
Threads and gaps are the same setting written two ways, and what the engine counts is requests per address per minute. Everything else is arithmetic around that figure.
I found mine with a ramp: one address, one city, increasing pace, watching for the first verification screen. Four evenings produced the table below, and I have worked from it since.
| Gap between requests | Threads per address | Tasks before the first screen | Repeat share over a full pass |
|---|---|---|---|
| none | 6 | 84 | 39 percent |
| 0.5 to 1.2 s | 4 | 310 | 14 percent |
| 1.4 to 3.6 s | 2 | none in 8830 | 2.1 percent |
| 3.0 to 6.0 s | 1 | none in 8830 | 1.8 percent |
The third row runs my pass. The fourth costs 80 extra minutes for three tenths of a percentage point, and the schedule has better uses for 80 minutes.
Randomising the gap did more than widening it. A fixed 2 second sleep collected screens at task 420 while a random window over the same average carried the full evening, since a request landing on the same fraction of a second for hours is a signal all by itself.
One habit from this stage: the pace is a property of the address, and it never gets recalculated per worker. My scheduler holds a per address timestamp, and a worker asking for a task on an address that answered 400 milliseconds ago waits its turn. That way adding workers raises throughput without touching the rate any single exit produces.
Stage six: telling a real results page from a substitute
Code 200 means the server answered. It carries no promise about what it answered with, and on this job three different objects arrive wearing that code: the results page, a verification screen, and a consent wall.
Four readings separate them, applied in order, before a parser is allowed near the body.
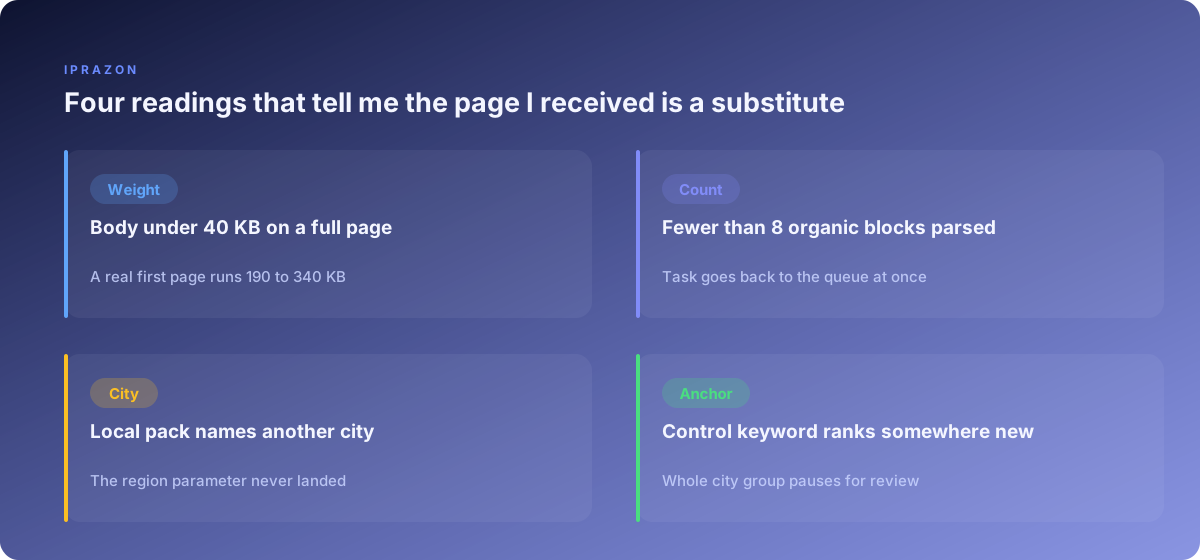
Body size is the first and cheapest. A genuine first page on my two engines weighs between 190 and 340 KB. A verification screen weighs 18 to 26 KB. A consent wall weighs about 40 KB. One integer comparison catches most of the traffic that would otherwise poison a report.
Block count is the second. A real first page carries at least 8 organic entries after parsing, and a page that parses to 3 is telling me something changed. The task goes back to the queue and the address it used gets a rest.
Region reading is the third, and it is the control keyword described earlier, fired on a schedule of every 300 tasks so its cost stays small.
The fourth is an anchor comparison against the previous pass. I keep 60 keywords whose positions have been stable for months, and if more than 12 of them move by more than 5 places in one week, the pass halts and I look at pages by hand before anything is written. That check has fired three times: twice on a genuine engine update, once on a subset of my exits receiving a different page than the rest.
FLOOR, MIN_BLOCKS = 60_000, 8

def page_state(resp, blocks):
    if len(resp.content) < 30_000:
        return "screen"
    if len(resp.content) < FLOOR:
        return "wall"
    if len(blocks) < MIN_BLOCKS:
        return "thin"
    return "ok"
Four states, four different reactions. A screen parks the address for 25 minutes and requeues the task. A wall means the consent cookie needs setting and the worker retries once. A thin page means the markup changed and the parser needs me. An ok page moves to the next stage. My last pass logged 268 screens, 41 walls, 19 thin pages and 8502 ok, and every one of those categories was actionable without me opening a browser.
Stage seven: reading positions out of the markup
Parsers that count from the top of the body produce numbers that drift a little every time the engine ships a layout change. My first version did that and reported a client's keyword at position 6 for three weeks while the engine had it at 3, because a question box and a video row sat above it.
The rule I follow now: classify every block, then number only the organic ones. Classification comes from structural attributes that survive redesigns, and the numbering happens afterwards in my own code.
from selectolax.parser import HTMLParser

def blocks(html):
    tree, out, rank = HTMLParser(html), [], 0
    for node in tree.css("div[data-result-kind]"):
        kind = node.attributes.get("data-result-kind", "")
        link = node.css_first("a[href]")
        if link is None:
            continue
        if kind in ("ad", "pack", "video", "question", "carousel"):
            out.append({"kind": kind, "rank": None,
                        "url": link.attributes.get("href")})
            continue
        rank += 1
        out.append({"kind": "organic", "rank": rank,
                    "url": link.attributes.get("href"),
                    "title": (node.css_first("h3").text() if node.css_first("h3") else "")})
    return out
Everything non organic still gets recorded with its kind and a null rank. That column answers the question the client asks whenever a position drops: the keyword stayed at 3 and a shopping row appeared above it, which is a different event from losing three places to a competitor.
URL normalisation is the last piece of this stage and the one that decides whether the report joins to anything. Engines wrap outbound links in redirectors, append tracking parameters, and vary between the bare host and the host with a prefix. My normaliser unwraps the redirector, drops the query string entirely, lowercases the host, strips a leading prefix and removes a trailing slash. Before it existed, the same client page counted as four separate results across one pass and the movement chart made no sense at all.
The offline check for this stage runs on saved pages. I keep 45 stored results pages covering both engines, all four cities, pages one through three, one page with a large local pack and one captured during a layout change. Running the parser over all 45 takes under two seconds and tells me whether today's markup still fits before a single live request goes out.
Stage eight: proving the report is complete
A pass that finishes is not the same as a pass that captured everything, and this stage is where those two get separated.
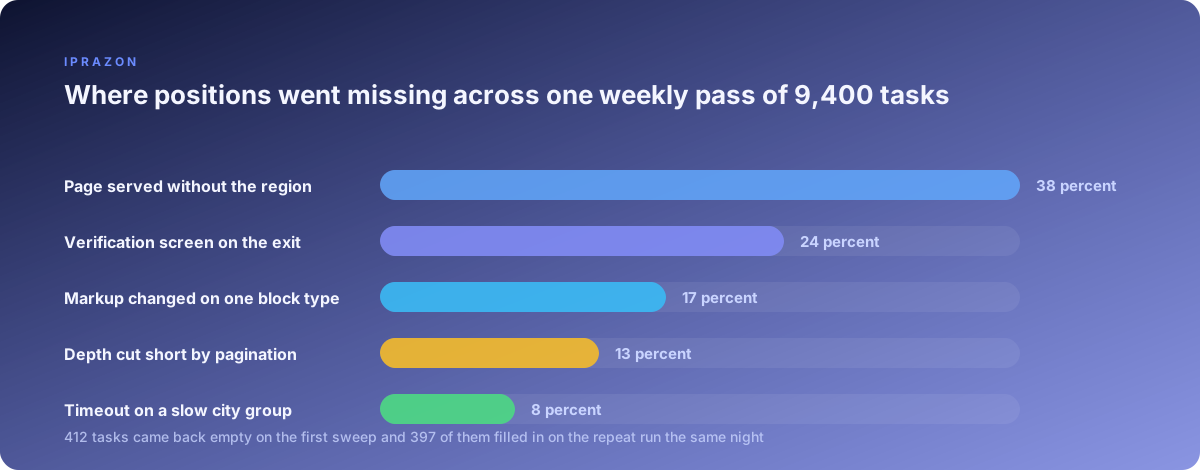
The first measure is arithmetic. Tasks planned, tasks fetched, tasks written, gaps. Those four numbers go into the log at the end of every pass and a gap share above 6 percent stops the report from being sent.
The second measure is coverage per keyword. A keyword tracked in four cities should produce four rows, and any keyword with fewer gets listed by name in a repeat file. My last pass produced 47 such keywords out of 3200, all of them in one city group that had met a screen during a 15 minute window.
The third measure is the repeat run itself. Gaps go back into a fresh queue with a different exit from the same country group, and the repeat runs an hour after the main pass. On my numbers the repeat recovers between 92 and 97 percent of gaps, which is the difference between a report I send and a report I apologise for.
The fourth measure is week over week comparison, which catches what the other three cannot. A pass can be complete, internally consistent and still wrong, and comparing the distribution of positions against last week is what surfaces it. My alert triggers when the median position across all tracked keywords moves by more than 1.5 places in a single week, since a genuine market shift of that size across 3200 keywords does not happen.
Rank capture running from a graphical tool goes through the same measures. When the job sits inside a capture profile built in A-Parser, the queue, the region and the depth ceiling live in the profile and my checks read its output file, so the arithmetic at the end of the pass stays identical regardless of what performed the fetching.
Every stage, and the check that closes it
Here is the summary I keep pinned next to the job. It reads as the pass runs, top to bottom, and each line names the one measurement that says the stage did its work.
| Stage | What we check | What a passing result looks like |
|---|---|---|
| Queue built | task count against unique identifier count | both numbers identical, duplicates collapsed on their own |
| Region pinned | control keyword per city, local pack compared | the expected business name appears in the body |
| Depth walked | page signature against the previous page | signature differs, or the task closes as finished |
| Address assigned | exit country matches the city group, range spread logged | 16 addresses across 5 ranges, four to a group |
| Pace applied | requests per address per minute, measured at the scheduler | no verification screen across a full evening |
| Page received | body weight, block count, state classified | between 190 and 340 KB and 8 organic entries or more |
| Positions read | block kinds counted, ranks assigned to organic only | non organic rows present with a null rank |
| URLs normalised | one host, one form, no query string | the client page counts once per results page |
| Pass measured | planned against fetched against written | gap share under 6 percent before anything is sent |
| Week compared | median movement across all tracked keywords | under 1.5 places, or the report waits for my eyes |
Ten lines, and eight of them existed only after a pass went wrong in a way that reached the client. The queue check and the pace check were there from the start because they are obvious. The region control, the page signature, the block classification and the week over week comparison each arrived as a repair, and each has since caught something the others missed.
What I would set up first on a new project of this kind is the exits, since the region reading, the pace and the cold start rate all depend on them and none of the checking code compensates for an address the engine already distrusts. Everything above that layer is a few hundred lines of Python and an afternoon of tuning, and it carries over to the next client with only the city codes and the keyword file changing.
Two neighbouring pieces cover ground I moved through quickly here: scraping with Python from the first request onwards works through the collection script itself, and how many addresses a pool actually needs does the arithmetic behind the 16 exits mentioned above.