What a proxy server does with your request: every hop on the path and what each side records
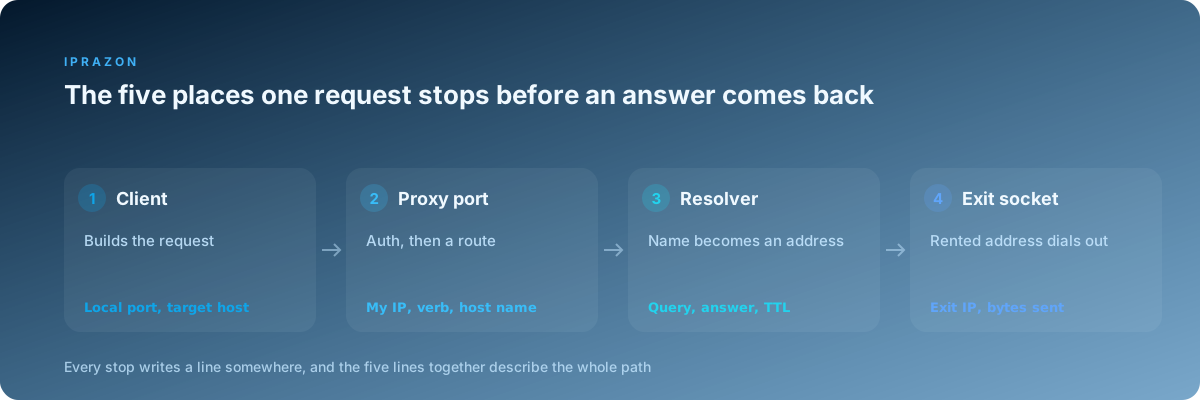
A request from my collector to a catalogue page stops in five places before an answer comes back. For a long stretch I treated four of those five as one grey box with a port number on it. Then a run started writing empty rows for about 8 percent of pages, the proxy access log showed status 200 on every one of them, and the same URL opened perfectly in a browser pointed at the same address. Two days went into that.
What fixed it was reading the path in order and asking one question at each stop: what can this side name, and where does it write that down. The answer turned out to sit at the last hop, in a header set the target read differently from my browser's. I would have found it in 20 minutes with the map I now keep.
This piece is that map. Every section takes one stop on the route, describes what happens there, names the log line produced at that point, and gives the command I run to confirm it. The figures come from my own desk: a pool of 24 addresses, a collector moving between 1,200 and 1,800 pages an hour, and a proxy access log that grows by roughly 340 MB a week.
Stop one: what the client decides before a byte leaves
Nothing has been sent yet, and three decisions have already been made inside my process.
The first decision is whether a proxy applies at all. Command line tools read http_proxy, https_proxy and no_proxy from the environment, libraries take a per session dictionary, browsers read a profile field, and a system wide setting sits under all of it. These sources override each other in an order that differs by tool, which is how a request escapes without me noticing. My own case: a no_proxy entry holding a bare domain matched 3 of the 11 shops I collect from, and those requests left from my office address for 11 days before a log review caught it.
The second decision is the scheme. http:// sends the request to the proxy as an HTTP message. socks5:// and socks5h:// open a SOCKS session, and the letter h at the end changes who resolves the name, which the next section covers in detail.
The third decision is the target port, and it quietly picks the whole shape of the exchange. Port 80 gets plain forwarding, where the proxy receives a full HTTP message it can read. Port 443 gets a CONNECT tunnel, where the proxy receives a host, a port, and then a stream of bytes it copies without opening.
At this stop the only log that exists is my application log, so I make it useful. Every request line I write carries the target host, the proxy endpoint actually chosen, and the local socket port. That third field becomes the join key later.
curl -v -x http://user:pass@proxy.example:8080 http://target.example/catalog 2>&1 | head -24
  # the verbose output names the proxy it picked, the request line it built,
  # and whether it opened a tunnel or forwarded the message directly
When the verbose output names an endpoint I did not expect, the environment won. That takes 5 seconds to check and settles a class of confusion that otherwise looks like a proxy fault.
Stop two: the socket to the proxy port and the greeting on it
Now a real TCP handshake happens, from my address to the proxy address on the port I bought. Three packets, one open socket, and a first line of evidence on the far end.
Authentication comes next, in one of two shapes. Login and password travel in a Proxy-Authorization header on the HTTP path, or as a small subnegotiation on the SOCKS path after the client offers method 0x02. The other shape is an address list: the proxy holds my source address and accepts a session from it with no credentials at all. I run the list form on scheduled jobs and credentials on anything that moves between hosts, and the list form saves one round trip per session, which showed up as a median drop from 214 to 196 milliseconds across 500 sample calls.
The proxy access log line appears here, and it holds more than most people expect. Timestamp, my source address and source port, the verb, the host asked for, the status, the bytes in each direction, and the duration. On plain forwarding it also holds the path and the query string.
1755172841.284    412 203.0.113.44 TCP_MISS/200 84213 GET
    http://target.example/catalog?page=3 - HIER_DIRECT/198.51.100.7 text/html
Reading that line left to right: duration in milliseconds, my address, cache verdict and status, response bytes, verb, full URL, and the address the proxy dialled out to. A failed greeting looks completely different, with status 407 on the HTTP path or a one byte SOCKS reply carrying a code other than 0x00.
I check the greeting on delivery day, before any job touches the endpoint. For HTTP work I take HTTP access on the same address list so the same credentials cover every port in the pool, which keeps the config to one line per address.
nc -vz proxy.example 8080                      # port open at all
curl -s -o /dev/null -w '%{http_code}\n' -x http://wrong:creds@proxy.example:8080 \
     http://target.example/                    # expect 407, a proxy that answers 200 here is not checking
That second command matters more than it looks. An endpoint answering 200 to wrong credentials is answering 200 to everyone, and everything I later read about that address in a log belongs to a crowd.
Stop three: where the hostname becomes an address
Between the greeting and the outbound socket, somebody has to turn target.example into four numbers. Which side does that changes what leaves my network.
On the HTTP path the proxy always does it, because I hand over a host name in the request line or in the CONNECT line and the proxy resolves it. On the SOCKS path the scheme decides. With socks5:// my client resolves the name locally and passes the finished address in the SOCKS request. With socks5h:// my client passes the name itself and the proxy resolves it at the exit.
The difference is measurable in one command. I run a capture on port 53 and fire both forms at the same target.
sudo tcpdump -ni any port 53 -c 40 &
curl -s -o /dev/null -x socks5://user:pass@proxy.example:1080  https://target.example/
curl -s -o /dev/null -x socks5h://user:pass@proxy.example:1080 https://target.example/
The first line produces queries in the capture. The second produces none. In one hour of collection through the first form my own resolver emitted 4,180 queries for hosts I was supposedly visiting from elsewhere, and each one carried my resolver's address to whoever runs authoritative DNS for those hosts.
There is a second effect, and this one costs time. A name resolved at my desk gives me the address my own network prefers, and a name resolved at the exit gives the address that region prefers, so a large site behind geographic routing answers from a different edge depending on which side asked. My latency on one such target moved from a median of 168 milliseconds to 402 when I switched the resolution point, with nothing else changed in the job.
For anything carrying its own client library I take SOCKS5 access on the same endpoint and write the scheme with the h in it, so name resolution and the outbound socket sit on the same side of the path. Every reading afterwards then describes one place.
| Setting in the client | Who resolves the name | What leaves my network | Where I confirm it |
|---|---|---|---|
http:// proxy scheme | The proxy, always | Host name inside the request | Proxy log holds the host, capture on 53 stays quiet |
socks5:// | My client, locally | A DNS query from my resolver | 40 packet capture on port 53 shows queries |
socks5h:// | The proxy, at the exit | The name inside the SOCKS request | Capture stays quiet, proxy log holds the host |
| System resolver overridden | Whatever the override points at | Depends entirely on the override | resolvectl query before the job, then the capture |
Stop four: plain forwarding and the request line that changes shape
On port 80 the proxy receives a complete HTTP message, and the first line arrives in a form browsers never send to an origin server.
A direct request opens with GET /catalog?page=3 HTTP/1.1 and carries the host in a separate header. A forwarded request opens with the whole URL in the request line, GET http://target.example/catalog?page=3 HTTP/1.1, so the proxy knows where to send it without parsing headers first. The Host header still travels alongside, and a mismatch between the two is one of the things a strict origin server rejects outright.
Headers change on this leg. Hop by hop fields such as Proxy-Connection and Proxy-Authorization belong to the conversation with the proxy and get stripped before the message continues. Some middle boxes then add fields of their own: Via naming themselves, X-Forwarded-For carrying my address, Forwarded carrying the same in a newer syntax, X-Real-IP doing it a third way.
Those additions decide how much of the point survives. An exit that appends my address to X-Forwarded-For is describing my desk to the target in plain text. I test this on every address the day it arrives, against an endpoint that echoes the full header set back to me.
curl -s -x http://user:pass@proxy.example:8080 https://ifconfig.me/all \
  | grep -Ei 'ip_addr|forwarded|via|x-real-ip|client-ip|remote_addr'
Six patterns, one command, and the answer is either four lines or one. I have taken delivery of an endpoint that passed X-Forwarded-For with my office address in it, and that would have quietly attached my network to every page the collector touched. Work that has to arrive with nothing extra attached runs behind an exit that adds no headers of its own, and the grep above is how I confirm the property on day one, long before day 30 turns it into an incident.
| Field | On a direct request | On plain forwarding | Inside a CONNECT tunnel |
|---|---|---|---|
| Request line | Path only | Full URL including query | CONNECT host:443 only |
Host | Present | Present, must agree with the URL | Inside the encrypted stream |
Proxy-Authorization | Absent | Present, stripped before the target | Present on the CONNECT line only |
Via | Absent | Added by some middle boxes | Not applicable to the payload |
X-Forwarded-For | Absent | Added by some middle boxes | Not applicable to the payload |
| Query string in the proxy log | No proxy involved | Recorded in full | Never visible |
Stop five: what a CONNECT tunnel keeps to itself
Port 443 changes the job of the middle box completely. My client sends one line, CONNECT target.example:443 HTTP/1.1, with credentials attached. The proxy opens its own socket to that host and port, answers HTTP/1.1 200 Connection established, and from that moment copies bytes in both directions without interpreting them.
TLS then starts inside that copied stream. The certificate exchange happens between my client and the target directly, so the proxy holds ciphertext and nothing else. Request paths, headers, cookies and bodies all live inside TLS records.
Two details stay visible to the middle box anyway, and both are worth knowing. The CONNECT line itself names the host, so the proxy log records which site I visited even though the pages stay closed. The first TLS record carries the server name in the ClientHello, so anything watching the wire reads the same host a second time. Byte counts and timing survive too, and a log line showing 84 KB out at a steady interval describes a collector fairly well.
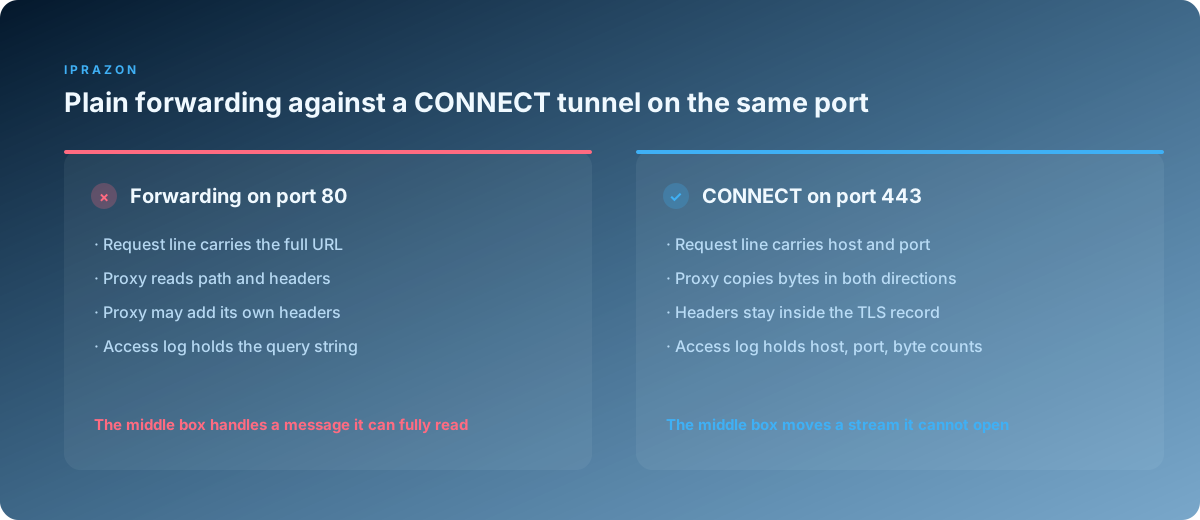
The practical consequence for me is where I look when something breaks. On the forwarding path the proxy log answers most questions on its own, because the full URL and the status sit right there. On the tunnel path the proxy log tells me the connection opened, how long it lived and how many bytes crossed, and everything about the content has to come from my client. That split explains why my debugging habits differ between HTTP jobs and HTTPS jobs, and why I keep verbose client logging switched on for the latter.
For work where the control channel itself has to stay closed all the way to the endpoint I use an HTTPS endpoint for the proxy conversation, so credentials travel inside TLS on the first hop as well as on the second.
Stop six: the outbound socket and the address the target will see
Here the proxy becomes a client. It opens a brand new TCP connection toward the target, and that connection needs a source address, taken from the addresses bound on the machine.
Which address gets picked is a configuration matter, and it decides everything about how the target groups my traffic. Two arrangements cover almost every pool I have used. In the first, one listener port maps to one exit address permanently, so port 30007 always leaves from the same place. In the second, the exit is selected per session or per interval from a group, which spreads a long run across many addresses.
Both arrangements earn their place on my desk. The pinned form carries account work and advertising profiles, where the target should see one steady origin for months. The changing form carries rank capture and wide collection, where a spread across many exits keeps a long run moving. I hold private IPv4 addresses that stay mine for the term for the pinned jobs, and I map every port to its address once, then keep the map in the collector config.
for p in $(seq 30001 30024); do
  printf '%s ' "$p"
  curl -s --max-time 8 -x "http://user:pass@proxy.example:$p" https://ifconfig.me
  printf '\n'
done | tee port-to-exit.txt
awk '{print $2}' port-to-exit.txt | cut -d. -f1-3 | sort -u | wc -l   # distinct /24 blocks
That loop takes under 4 minutes and produces two facts I use constantly: the address behind every port, and how many distinct network blocks cover the pool. My 24 addresses sit across 6 blocks, and I know that figure because the second line counts them for me. A page saying 6 carries less weight than a count I ran myself.
Where the pool physically sits belongs to this stop too. Server addresses in a datacenter network hold a stable route and a stable latency profile, which is what makes the timing numbers in the next two sections repeatable enough to compare week over week. When exclusivity matters to the reading, an address issued to a single buyer means the history the target has built for that address describes my traffic and nothing else.
Stop seven: what the target writes down about the visit
The request arrives. From the target's side it came from one address, carried one header set, and opened TLS with one particular hello. That is the whole of what the far end can name about me.
The access log line holds the source address, the timestamp, the request line, the status, the response size, the referer and the user agent. Nothing in that line points back to my desk, because the source address belongs to the exit and the connection genuinely originated there.
Above the access log sit two readings that my early debugging ignored completely. The TLS ClientHello carries a cipher list, an extension list and their order, which together form a fingerprint stable per client library and per version. HTTP/2 adds a settings frame and a pseudo header order that differ between a browser and a scripted client in the same way.
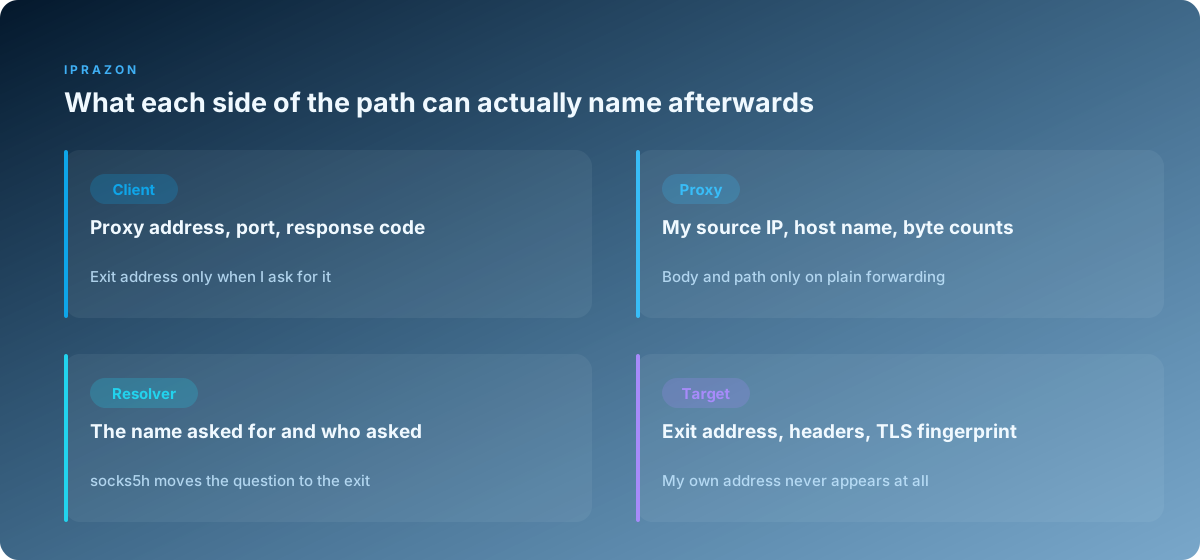
This is where my two lost days ended. The proxy was fine, the address was fine, the status was 200 on both sides, and the body coming back was 812 bytes of a check page my parser stored as an empty row. The target had read a header set that no browser sends, decided accordingly, and logged a perfectly ordinary 200. Once I compared the two header sets side by side the fix took one commit.
| What the target sees | Where it comes from on the path | How I read it myself |
|---|---|---|
| Source address | The exit socket at stop six | curl -x ... https://ifconfig.me per port |
| Header names, values and order | My client, minus hop by hop fields | Echo endpoint returning the full set |
| TLS fingerprint | My client library, untouched by the tunnel | A fingerprinting page through the same address |
| Timing and volume | The full round trip | -w timing fields on 200 sample calls |
| Cookie and session state | My own storage, carried in the request | Profile inspection before the run |
Stop eight: the answer travelling back
The response walks the same path in reverse, and each stop treats it a little differently.
On the tunnel path there is no treatment at all: bytes come back through the copy loop in the order they arrived. On the forwarding path the proxy reads the response headers, may buffer part of the body, and applies its own timeouts to the transfer. A chunked response held open by a slow origin sits inside that buffer, and the proxy decides how long to wait before giving up on it.
Timeouts are where the asymmetry between logs becomes useful. My client distinguishes a connect timeout, which means the first hop or the outbound socket never completed, from a read timeout, which means the connection stood open and the bytes stopped. Those two point at different stops, and I have written that distinction into every job wrapper I own.
curl -s -o /dev/null -x http://user:pass@proxy.example:8080 \
  -w 'connect %{time_connect} first-byte %{time_starttransfer} total %{time_total} code %{http_code}\n' \
  https://target.example/catalog
Three timings from one call, and the gaps between them name the slow stop. A large connect figure with a small remainder points at the first hop or at name resolution. A small connect figure with a long wait for the first byte points past the exit, at the target working or at a queue in front of it. Across 200 calls on my kept pool those figures came out at 41, 168 and 214 milliseconds at the median, with the ninety fifth percentile at 402 and the worst single call at 1,340.
I record all three in the run log, per job, every night. Comparing tonight's distribution against last week's has caught a changed route twice, both times before any job started failing outright.
Stop nine: reading the three logs as one story
Each stop keeps its own record, and the records only become an explanation once they line up. Two fields do the joining.
The first is the timestamp, in UTC on every machine involved. The second is my client's local source port, which appears in my application log and again in the proxy access log as the source port of the incoming session. That pair identifies one request exactly, even in a night with 14,000 of them.
curl -s -o /dev/null -x http://user:pass@proxy.example:8080 \
  -w 'local %{local_port} proxy %{remote_ip} code %{http_code} total %{time_total}\n' \
  https://target.example/catalog
  # %{remote_ip} names the proxy on this leg, the exit address comes from an echo endpoint
With those two fields written on both sides, a single grep across the proxy log answers questions that used to take an afternoon. Did the request reach the proxy at all. Which exit did it leave from. How many bytes came back. How long did the far side take. Four answers, one line, and the stop that misbehaved names itself.
My collector writes a request id into its own log next to the local port, and the id travels into the parser log as well. That gives a third link in the chain, from a stored row all the way back to the socket that fetched it. Rebuilding one suspicious row now takes about a minute.
Stop ten: which log names the break
Failures on this path look similar from the outside and come from very different places. This is the table I keep open while debugging, built from cases I actually had.
| What I observe | The stop responsible | What I run first |
|---|---|---|
| Request never appears in the proxy log | Stop one, client config | curl -v and read the endpoint it chose |
| Status 407 on every call | Stop two, greeting | Recheck credentials, then the source address list |
| Queries on port 53 leaving my host | Stop three, resolution point | Switch the scheme to socks5h://, recapture |
| Target rejects the message with 400 | Stop four, request line and Host | Compare the two host values in a verbose dump |
| Proxy log shows only host and byte counts | Stop five, working as designed | Read the client log, the content lives there |
| Two ports report the same exit address | Stop six, exit mapping | Rerun the port loop, then ask for the map in writing |
| Status 200 with a body my parser cannot use | Stop seven, header set or fingerprint | Diff my headers against a browser capture |
| Read timeout with a completed request upstream | Stop eight, buffering and limits | Split the timing with the -w fields above |
| Everything looks fine and results disagree | Stop nine, no correlation yet | Add local port and request id to both logs |
Nine rows, and eight of them used to look identical to me: a job that returned less than it should. The table exists because each row has a different first command, and running the right one first is the difference between 20 minutes and two days.
One habit closes the loop. Once a month I walk the whole path against a target I control, with a capture running at each stop, and write down the readings while everything works. A known good baseline turns the next investigation into a comparison, and comparisons are fast. That baseline is also the reason I would buy an IPv4 proxy server on these same terms again: the readings stay steady enough that a change in them means something real happened.
Two neighbouring pieces cover the choices this path leaves open: picking HTTP, HTTPS or SOCKS5 by the job works through the protocol decision at stop one in detail, and choosing an address for the work ahead goes deeper into the exit properties that decide what stop seven records.