
How to test a proxy before you rely on it: the probes that catch dead addresses
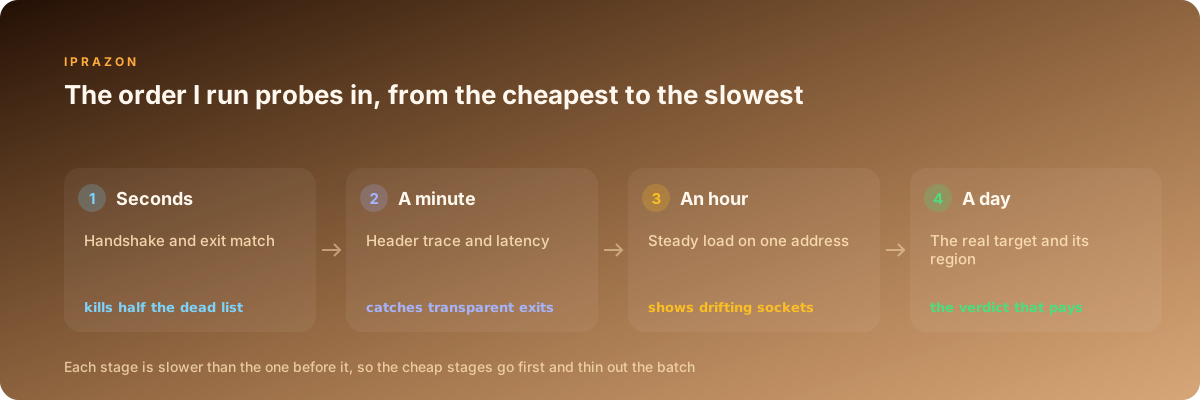
Every batch of addresses I take into work goes through the same series of probes before a single production request touches it. The order is fixed. Cheap probes run first, slow probes run last. A handshake test costs me seconds, an hour of load costs me an hour, so I want the dead addresses gone long before the expensive stages begin.
Below are seven probes in the order I run them. For each one I give the command, the answer I expect back, and the reading that sends an address out of the batch. The figures come from one screening run of 64 addresses that I prepared for a price collection job on three retail sites.
I run the series because a skipped check has a price I have already paid. A collection window opened at night, 4 workers went out through addresses I had merely pinged, and by morning I had 11 hours of retries and a partial dataset. Since then nothing enters production untested.
Probe one: does the tunnel answer at all
The first question is the dumbest one, and it removes more addresses than any later stage. Does the port answer, and does it accept the credentials I was given?
curl -x http://LOGIN:PASS@IP:PORT \
     -s -o /dev/null \
     -w '%{http_code} connect=%{time_connect}\n' \
     --connect-timeout 8 --max-time 20 \
     https://ifconfig.me/ip
I want 200 and a connect time under 0.4 seconds from my node in Frankfurt. Three answers end the conversation early. A connect timeout means the port is not listening or a firewall drops the packets on the way. curl: (56) Recv failure on a port that did open usually points at the wrong protocol on that port, so I try the SOCKS form of the same pair before writing it off. Code 407 means the credentials or the IP authorisation record do not line up, and that is a support ticket, never a fault of the address itself.
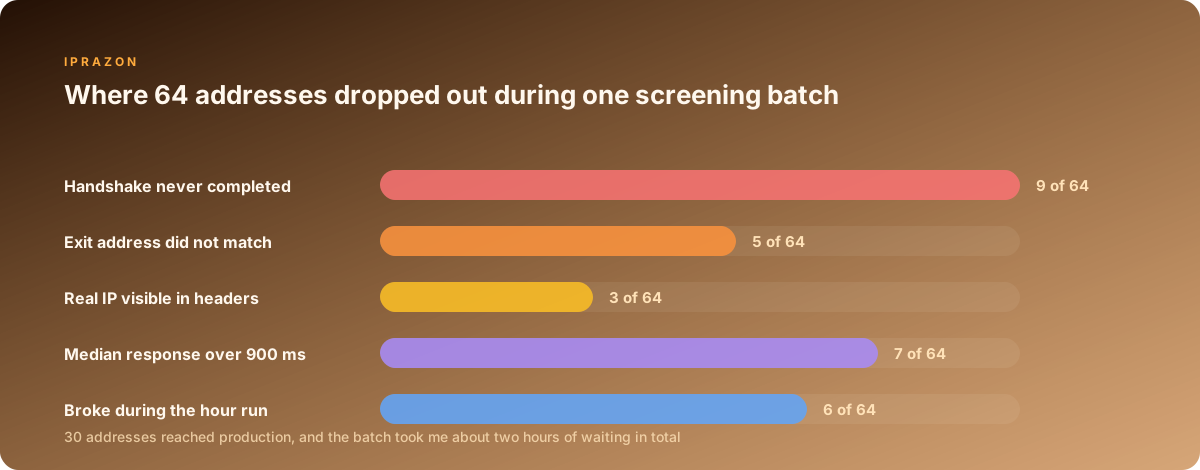
One retry, then a verdict. I repeat the command once with a fresh connection, because a single dropped SYN happens on any network. Two failures in a row and the address leaves the batch. In my run of 64 addresses, 9 never completed a handshake, and all 9 came from a batch a colleague had been holding since spring without touching it.
Timing matters here as well. A connect time above 1.2 seconds on a plain HTTPS request tells me the route goes somewhere unpleasant, and I mark the address for a closer look at probe four.
Probe two: does the exit address match the record
An address that answers is worth nothing until I know which IP the far side actually records. The pool record says one thing, and the site can see something completely different.
for ip in $(cat batch.txt); do
  seen=$(curl -x "http://LOGIN:PASS@${ip}:8080" -s --max-time 15 https://icanhazip.com)
  echo "${ip} -> ${seen:-DEAD}"
done
I expect seen to equal the address from my list, character for character. Three outcomes get an address rejected. An empty answer with a live handshake means something terminates the request between me and the endpoint. A different IP from the same subnet points at a gateway that reroutes traffic across its own pool, which breaks any job where the address has to stay pinned to a profile. An IP from a different country is the loudest signal of all, and I send that pair straight back with the log attached.
Five addresses in my run reported an exit that differed from the record. Four of them showed neighbouring IPs from one /24, one showed a completely different provider. This is exactly the failure that stays invisible until an account asks for verification, which is why I hold account work on a private pool where the exit belongs to me alone and check the pairing on every new batch.
Two details save time at this stage. Query a second detector, since a single service can cache an answer or sit behind its own front layer. And run the check through the same library your production code uses, because a tool can hold its own routing settings that a shell command never sees.
Probe three: what the tunnel adds to the request headers
The exit can be correct while the request still carries my own IP in a header. A transparent exit answers every earlier probe perfectly, so this stage exists to read what the far side receives.
I keep a small echo endpoint on my own host that prints the request as it arrives.
curl -x http://LOGIN:PASS@IP:PORT -s https://echo.mynode.net/h | \
  grep -Ei 'x-forwarded-for|via|forwarded|client-ip|proxy-connection'
An address passes when that command returns nothing at all. Any line with my home or office IP in it makes the address unusable for profile work, since a platform reading X-Forwarded-For ties every session behind that exit to one origin. A Via line without my IP is softer, though it announces a proxy layer to anyone parsing headers, and platforms with a filtering layer treat that announcement as a reason to look closer.
Three addresses out of 64 leaked. All three came from one supplier and all three had passed probes one and two without a mark. That is the point of running the header stage separately, and it is also why I buy addresses that carry no header traces for anything involving logins.
Run this probe against your own endpoint if you can. Public header echoes go through their own edge layers, and those layers add and strip fields, so the output describes the edge as much as it describes your tunnel.
Probe four: how quickly the first byte comes back
Reachability says the address works. Speed says whether it can hold a schedule. I take 10 requests to a small static file and read the median, since one slow sample proves nothing.
for i in $(seq 1 10); do
  curl -x http://LOGIN:PASS@IP:PORT -s -o /dev/null \
       -w '%{time_connect} %{time_starttransfer} %{time_total}\n' \
       --max-time 25 https://echo.mynode.net/64k
done | sort -k2 -n | awk 'NR==5{print "median ttfb", $2}'
Two figures interest me: time to first byte and the spread between the fastest and slowest of the 10. A median of 240 ms with a spread of 90 ms describes an address I can plan around. A median of 300 ms with a spread of 1.4 seconds describes a route that will produce timeouts at any concurrency worth running.
| Median time to first byte | Spread across 10 samples | Where the address goes |
|---|---|---|
| under 300 ms | under 200 ms | any job, including browser profiles |
| 300 to 600 ms | under 400 ms | collection jobs and background tasks |
| 600 to 900 ms | any | held in reserve, single threaded work only |
| above 900 ms | any | rejected before the next stage |
| any median | spread above 1 second | rejected, the route is unstable |
Seven addresses failed on the median, and two more passed the median while failing on spread. I count the second group as the more dangerous one: they look healthy in a quick test and then produce a scattering of read timeouts once 20 threads share the route. For collection work at pace I take addresses selected for scraping loads, where the route quality is part of what I am paying for.
Probe five: an hour of steady load on one address
Everything up to here takes about a minute per address. This stage takes an hour, and it is the one that separates addresses that work from addresses that keep working.
I drive a single address at the pace my job will actually use, then read the error share in 5 minute buckets.
import time, requests, collections
P = {"http": "http://LOGIN:PASS@IP:PORT", "https": "http://LOGIN:PASS@IP:PORT"}
bucket, stats = 0, collections.Counter()
start = time.time()
while time.time() - start < 3600:
    bucket = int((time.time() - start) // 300)
    try:
        r = requests.get("https://echo.mynode.net/64k", proxies=P, timeout=20)
        stats[(bucket, r.status_code)] += 1
    except Exception as e:
        stats[(bucket, type(e).__name__)] += 1
    time.sleep(1.2)
for k in sorted(stats, key=lambda x: x[0]):
    print(k, stats[k])
At roughly 1 request per 1.2 seconds that gives me about 3000 requests per address per hour. I read three things from the buckets. The error share in each bucket should stay under 2 percent. The error share in the last bucket should look like the error share in the first. And connection errors should not arrive in clusters, because a cluster of 15 failures inside one minute describes a session that dropped and took every worker with it.
Six addresses broke during the hour. Four were quiet for 20 minutes and then produced a wall of connection resets, which is the signature of a session limit somewhere on the path. Two drifted: 0.4 percent errors in the first bucket, 3 percent by the tenth, 9 percent by the twelfth. Both would have survived a 5 minute test and both would have ruined a night run.
Traffic accounting shows up here too. An hour at this pace moved about 190 MB per address, and on a metered package that stage alone eats a noticeable share of the allowance. I run the load probe on addresses with no traffic cap so that testing never competes with production for the same budget.
Probe six: what the real target says to that address
Every probe so far used my own endpoints. Now the address meets the site it will actually work against, because a filter on that site has opinions my echo server knows nothing about.
I send 5 requests to a real product page, spaced 30 seconds apart, with the same headers and the same client profile my collector uses.
for n in 1 2 3 4 5; do
  curl -x http://LOGIN:PASS@IP:PORT -s -o /tmp/p.$n \
       -w "%{http_code} %{size_download}\n" \
       -A "$UA_STRING" -H 'Accept-Language: de-DE,de;q=0.9' \
       --max-time 30 "https://target.tld/catalogue/item/44182"
  sleep 30
done
grep -ci 'add to basket' /tmp/p.1 /tmp/p.5
The status code alone lies often enough that I check the body size and one marker string as well. A page that returns 200 at 3 KB where the real page weighs 180 KB is a stub, and a collector reading only status codes will happily record thousands of empty pages.
| What the target returned | How I read it | What I do with the address |
|---|---|---|
| 200 with the full markup | the filter has no record of this address | goes into the working pool |
| 200 with a short stub body | soft filtering by address | park, retest in a week |
| 403 on the very first request | the address sits on a blocklist | reject for this target |
| 429 by the third request | the exit is shared, the quota is spent | reject, the pool is oversubscribed |
| 503 with a verification page | the filter wants a browser challenge | park, browser profiles only |
| 200 with a redirect to another country | region mismatch, see the next probe | send to probe seven |
Four addresses in my run answered 403 immediately. Since the same batch cleared every technical stage, the addresses were technically fine and simply carried history with that particular retailer. Addresses with history are the reason I hold datacenter addresses on owned hardware for retail collection: on a pool where the operator controls who works from it, that history stays short.
One caution about this probe. Five requests are enough for a verdict and few enough to leave no trace worth noticing. Sending 500 test requests through a fresh address tells you nothing extra and teaches the filter your pattern before the job even starts.
Probe seven: does the region hold up on the target side
A region field in a pool listing describes a database record. What matters is where the target platform believes the address to be, and those two answers disagree more often than any provider would like.
I check three signals in order. First the plain geo databases, because a mismatch there is easy to see and easy to report. Then the target itself: which language version it serves, which delivery region it preselects, whether it redirects to a country domain. Finally the platform search results, since a marketplace ranking local sellers first gives a clear answer about the region it assigned me.
curl -x http://LOGIN:PASS@IP:PORT -s "https://ipapi.co/json/" | \
  python -c "import sys,json; d=json.load(sys.stdin); print(d['ip'], d['country_code'], d['region'], d['asn'] if 'asn' in d else '')"
curl -x http://LOGIN:PASS@IP:PORT -s -o /dev/null -w '%{redirect_url}\n' \
     --max-time 20 "https://target.tld/"
Two addresses in my run sat in a database as German while the retailer served them the Austrian storefront with different assortment and different sorting. For a price job that difference corrupts the dataset quietly, and I only found it because the probe compares the served storefront with the expected one. Both addresses went to a different job where the region carries no weight.
Region drift also appears later in an address's life, so I repeat this probe monthly on the working pool. When a job needs the region to stay put for weeks, I keep it on private addresses with a fixed exit point, and I re-run the geo comparison after any package change on the provider side.
The probe table: what each stage shows and when an address is rejected
This is the whole series in one place, with the exact condition that ends an address's participation in the batch. I keep it beside the terminal and follow it in order.
| Probe | What it shows | When the address is rejected |
|---|---|---|
| Handshake | the port answers and the credentials work | two connect timeouts in a row, or a 407 that support cannot clear |
| Exit match | which IP the far side records | the recorded exit differs from the pool record |
| Header trace | what the tunnel adds on the way out | any forwarded header carrying my own IP |
| First byte | route quality under a single request | median above 900 ms, or spread above 1 second across 10 samples |
| Hour of load | stability at the pace of a real job | error share above 2 percent in any 5 minute bucket, or a rising trend |
| Target answer | whether the platform already knows the address | 403 on the first request, or 429 inside 5 requests |
| Region | where the platform places the address | a storefront or language version that breaks the dataset |
Two lines in that table deserve a note. The rising trend under load matters more than the absolute figure, since an address at 1 percent errors climbing steadily will cross any limit you set by the third hour of a night run. And a 429 during probe six says something about the whole pool: the quota for that target is being spent by people I share the exit with, which is a reason to change pool, never a reason to slow down my own collector.
Running the series across a batch and inside the real tool
Address by address this series would take a working day. I run stages one through four across the entire batch in parallel, then take only the survivors into the hour of load.
cat batch.txt | xargs -P 16 -I{} bash -c '
  ip="{}"
  code=$(curl -x "http://LOGIN:PASS@${ip}:8080" -s -o /dev/null \
         -w "%{http_code}" --connect-timeout 8 --max-time 20 https://ifconfig.me/ip)
  seen=$(curl -x "http://LOGIN:PASS@${ip}:8080" -s --max-time 15 https://icanhazip.com)
  ttfb=$(curl -x "http://LOGIN:PASS@${ip}:8080" -s -o /dev/null \
         -w "%{time_starttransfer}" --max-time 25 https://echo.mynode.net/64k)
  echo -e "${ip}\t${code}\t${seen:-NONE}\t${ttfb}"
' > stage1.tsv
awk -F'\t' '$2==200 && $1==$3 && $4<0.9 {print $1}' stage1.tsv > survivors.txt
Sixteen parallel workers put the first four stages for 64 addresses inside 4 minutes. The load stage runs on survivors only, 8 addresses at a time in one hour blocks, which turned into two evenings of unattended waiting for the batch. Target and region probes finished the following morning.
The output file is worth keeping. When an address misbehaves two weeks later, the row from screening tells me what it looked like on day one, and that comparison usually points at the cause faster than any live debugging session.
One part of the series never gets automated, and that is the repeat pass through the tool that will actually carry the job. A shell test proves the address works for curl. Production runs through a scraper, a browser profile or a task scheduler, and each of those has its own connection layer with its own settings.
For collection frameworks I repeat probes two and three from inside the framework itself, with one request through the same client the job uses. For browser profiles I open the detection page in the profile window and read the address, the headers and the timezone together, because a profile can hold an address setting that quietly reverts after an update. For SOCKS work I confirm which flavour the tool sends: name resolution on my side against resolution at the exit changes what the target sees, and I keep a SOCKS5 address for tool integrations tested in both modes before a job depends on it.
The one rule I follow without exception: the probe has to run through the same path as production. A test that takes a different route answers a question nobody asked.
What the series costs and what it returns
Two hours of attention across two evenings, plus the hour blocks that ran while I did other work. That is the whole investment for a batch of 64 addresses, and 30 of them reached production with a record of how each one behaved.
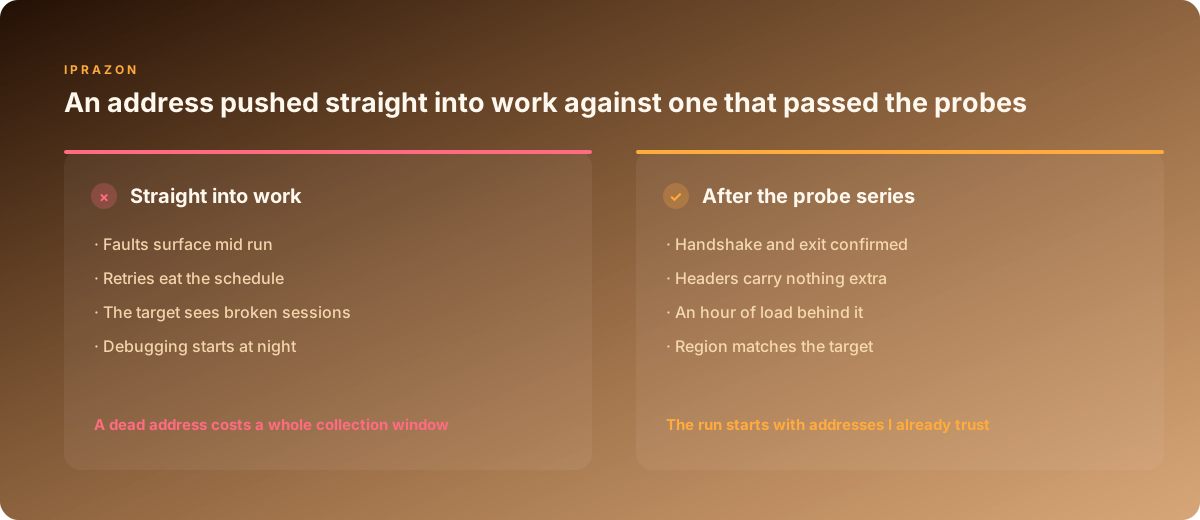
The comparison I care about comes from the two collection cycles that followed. On the screened pool, the night job finished inside its window on 13 nights out of 14, with a retry share of 1.7 percent. On the previous cycle, run on an unscreened batch of similar size, the job overran its window 6 times in 14 nights and the retry share sat at 9 percent. The dataset from the second cycle also had 400 pages of Austrian assortment mixed into German prices, which took an afternoon to find and rebuild.
The stages pay off unevenly. Probes one and two cost seconds and remove roughly a fifth of a typical batch. The hour of load is the most expensive stage by wall time and it catches the faults that hurt most, since a drifting address fails at the worst possible moment. The target probe is the one I would keep if I could keep only one, because it is the only stage that asks the site itself.
Related material from this series: proxy speed test and sOCKS5 proxy.