
How to scrape data from Google Maps and business directories: the grid, the depth ceiling, the duplicates

Collecting local business cards looks like the friendliest job on the board. Names, addresses, phone numbers, opening hours, all of it sitting in the open for anyone with a browser. I took that job for a services aggregator and spent the first week rather pleased with myself: 4,300 rows in the database by the third day, no errors in the log, the parser handling every field. Then a colleague pulled a register from the chamber of commerce, we compared lists, and I discovered I was holding roughly a quarter of the city.
Nothing had failed. My selectors matched, my requests came back with status 200, and every stored row was accurate. The source had simply never shown me the rest, because a map search answers a question about a rectangle on screen and stops at a fixed depth, and I kept asking it about a whole metro area in one go. Below is how these sources are built, what each property forces on the collector, and how I verify that the verification itself worked. All figures come from one metro area of 640 square kilometres and a list of 34 category terms.
The source answers a question about a viewport
A map search takes two inputs: a term and a box. The term is what I type. The box is the rectangle the map happens to be showing, and it does more work than the term does, because ranking runs inside that rectangle, weighing distance from its centre against how prominent a place looks among its immediate neighbours. Shift the rectangle two kilometres east and the identical term returns a different set, in a different order, with a different tail.
That single property sets the shape of the whole job. My unit of work stopped being a query and became a triple: term, box, page number. Every row landing in the database carries the box it came from, which feels like pointless bookkeeping right up to the first time somebody asks why a place is missing and I can answer with a cell id and a timestamp.
Two ways of describing the box show up in these sources. Some take a centre point and a radius, some take four corner coordinates. A radius covers a circle, so a square area described that way loses its corners, and I set the radius to half the diagonal of the cell so the circles overlap at the seams. The overlap costs requests and buys coverage, and I have never regretted the trade.
How I check it: take two boxes overlapping by about a fifth of their width, run the same term through both, count identifiers that appear in both result sets. On my grid that shared slice sits between 12 and 18 percent. When it comes back near zero, the box parameter is being dropped somewhere in the request chain and the source is answering about some default region of its own choosing.
The result set stops at a fixed depth
Every one of these sources has a ceiling, and the ceiling is low. A map search endpoint hands me 20 rows per page and issues at most two continuation tokens, so 60 places per term per box is all that exists. A large directory pages 25 at a time and refuses to go past page 40. Neither of them tells you this. They return status 200, a well formed body, and a row count that looks like an answer.
A result set holding exactly the ceiling is a failure report wearing a success costume. My rule since that first project: returned == page_size * max_pages is an error condition, logged as one, and it puts the cell back in the queue marked for splitting.
| Source shape | Rows per page | Pages I can reach | Ceiling per query | What happens past it |
|---|---|---|---|---|
| Map search endpoint | 20 | 3 | 60 | the continuation token stops arriving |
| Map search in the web client | 20 | 6 | 120 | the list quietly stops extending on scroll |
| Directory category page | 25 | 40 | 1,000 | page 41 serves page 40 again with status 200 |
| Directory with a district filter | 25 | 40 per district | 1,000 per district | same repeat, counted per district |
The row about page 41 deserves a moment. That directory answers with the previous page's content and no marker of any kind, so a walker that trusts the page counter collects the same 25 cards nine times and reports 1,225 rows for a category holding 1,000. I compare the identifier set of page N against page N minus one and stop the walk when they match, which took four lines and removed a whole class of phantom growth from my counts.
How I check it: a cap-hit rate per pass, meaning the share of cells that came back holding the ceiling. Under 1 percent I call the pass complete on depth. My first city pass ran at 26 percent and I read it as a healthy result, because 26 percent of my cells were returning full pages and full pages felt like productivity.
Continuation tokens carry state, and the state expires
The token that fetches page two is not a page number in disguise. It encodes the original term, the original box, the offset and a session marker, and it comes with three properties that each cost me a debugging evening.
It needs a pause before it works. Fire the second request immediately and the source answers with an empty list and status 200. I wait 2.2 seconds, measured upward from 1.5 where empty pages still appeared on about 4 percent of walks.
It expires. Around 60 seconds after issue, a token stops resolving, so a queue that batches page one across a thousand cells and comes back for page two later throws away every walk it started. I keep the depth walk inline: page one, pause, page two, pause, page three, then move on.
It is bound to the exit it was issued through. Send the token from a different address and the answer is empty or an error, depending on the source. That failure is nasty because an empty page two reads exactly like a category that genuinely held 20 places, and the row lands in the database as a completed cell.
import time, httpx

PROXY = "socks5://user:pass@node.example.net:1080"

def walk_cell(client, term, box, max_pages=3):
    rows, token, page = [], None, 0
    while page < max_pages:
        params = {"q": term, "bbox": box, "lang": "en", "region": "de"}
        if token:
            params = {"pagetoken": token, "lang": "en", "region": "de"}
        r = client.get(ENDPOINT, params=params, timeout=25)
        body = r.json()
        batch = body.get("results", [])
        if page and {x["id"] for x in batch} == {x["id"] for x in rows[-len(batch):]}:
            break                      # the source is repeating itself
        rows += batch
        token = body.get("next_page_token")
        page += 1
        if not token:
            break
        time.sleep(2.2)
    ceiling = len(rows) >= 20 * max_pages
    return rows, ceiling, page

with httpx.Client(proxy=PROXY, headers=HEAD) as c:   # one client, one exit, one walk
    rows, ceiling, pages = walk_cell(c, "dental clinic", "13.28,52.46,13.34,52.50")
One client for the whole walk is the part that matters. I run these walks through a SOCKS5 endpoint for the collector so the tunnel, the session and the token all stay with one exit from page one to the end of the cell. My share of walks that ended at page two with a full page one sat at 3.1 percent while the pool rotated per request. After pinning the walk it went to 0.2 percent, and those remaining cases were genuine timeouts.
Laying a coordinate grid over the area
The grid is arithmetic on a sphere and takes twenty minutes to write. A degree of latitude runs about 111.32 kilometres anywhere; a degree of longitude runs that same distance multiplied by the cosine of the latitude you are standing on. Convert a step in metres into two degree steps, walk the bounding box of the metro area, emit a cell per position.
from math import cos, radians

def grid(south, west, north, east, step_m=2000, margin=0.15):
    dlat = step_m / 111_320
    cells, i = [], 0
    lat = south
    while lat < north:
        dlon = step_m / (111_320 * cos(radians(lat)) or 1)
        lon = west
        while lon < east:
            pad_lat, pad_lon = dlat * margin, dlon * margin
            cells.append({
                "id": f"c{i:05d}",
                "box": (lat - pad_lat, lon - pad_lon,
                        lat + dlat + pad_lat, lon + dlon + pad_lon),
                "edge_m": step_m,
                "parent": None,
            })
            i += 1
            lon += dlon
        lat += dlat
    return cells
The margin of 15 percent is the seam insurance. Without it a place sitting on a cell boundary can fall between two rectangles when the source rounds coordinates its own way, and the miss is invisible: no error, no gap in the count, one row that never existed as far as the report knows. The margin manufactures duplicates on purpose, and duplicates are cheap to merge later.
My metro box came to 640 square kilometres, which at a 2 kilometre step gives 160 root cells. Each carries its own id, and the id is the handle for everything downstream: retries, splits, log lines, the address it ran through.
How I check it: I keep a list of 12 addresses I know by hand, geocode them, and test membership before any pass runs. Every one has to fall inside at least one cell and most fall inside two, which confirms both the coverage and the overlap. When I moved the grid to a second city I ran that test first and caught a sign error on longitude that would have collected a rectangle of open farmland.
Cell size against density, and the rule for splitting
A fixed cell size is wrong everywhere at once. Two kilometres in the centre swallows 300 places and returns 60 of them. The same two kilometres over an industrial belt returns four rows and costs the same three requests.
So the grid subdivides itself. A cell that comes back at the ceiling splits into four children at half the edge, the children go into the queue, and they inherit the parent's exit address so the source keeps seeing one consistent client working one part of town. I stop at four levels, which takes 2 kilometres down to 250 metres.
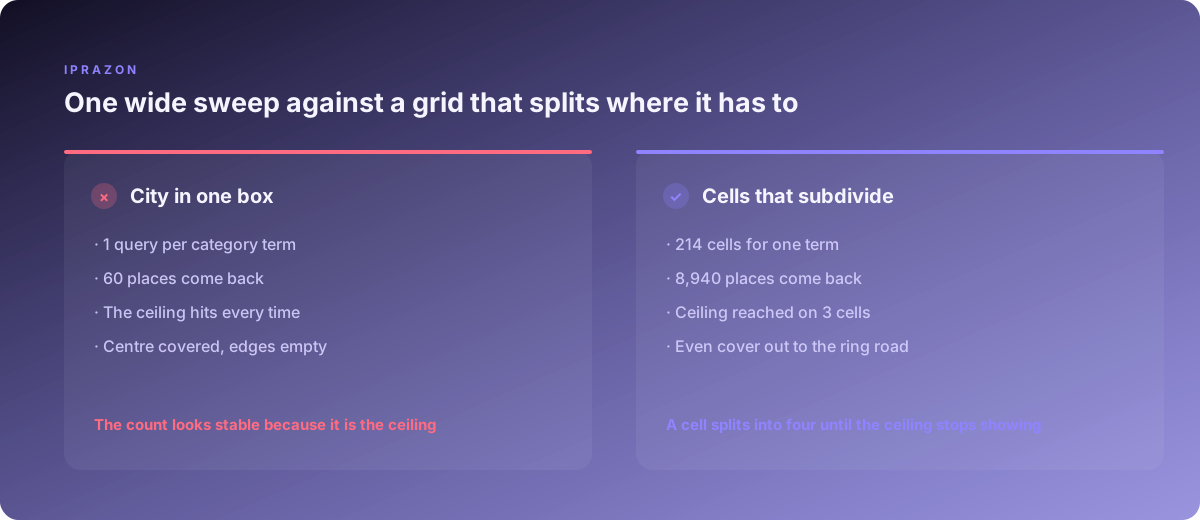
Here is the same category term, dental clinics, collected four ways over the same metro area on four consecutive nights.
| Cell edge | Cells walked | Cells at the ceiling | Unique places found | Requests spent |
|---|---|---|---|---|
| 8 km | 10 | 10 | 512 | 30 |
| 4 km | 40 | 27 | 2,180 | 118 |
| 2 km | 160 | 41 | 6,050 | 447 |
| adaptive from 2 km | 214 | 3 | 8,940 | 623 |
The adaptive pass spent 39 percent more requests than the flat 2 kilometre pass and returned 48 percent more places. Three cells stayed at the ceiling even at 250 metres, and all three sit on the same medical centre building where 60 practices share one street address. I accept those three and note them, since splitting further returns the same rows through a smaller window.
The rule works downward as well. Cells returning zero or one row get merged back with their siblings before the next pass, and on my second run that trimmed the request count by 19 percent with no change in what came home. The grid ends up dense where the city is dense and coarse where it is empty, which is the shape you would draw by hand if you had a month to spend on it.
The same place arrives four times over
My first city pass produced 61,400 rows for what turned out to be 18,700 places. That ratio is normal and it is mostly my own doing, since the overlap margin exists precisely to collect things twice.
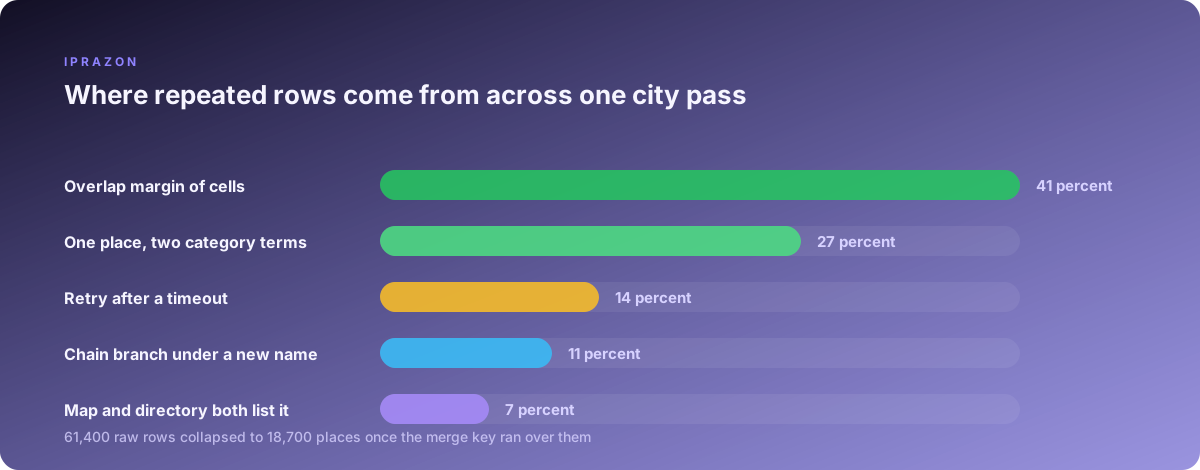
The merge key decides everything downstream, and mine works in two tiers. When the source hands over a stable place identifier, that identifier wins alone. When it does not, I build a key from three normalised parts: the name, the coordinates rounded to four decimal places, and the phone number in international form.
import re, unicodedata

LEGAL = r"\b(ltd|limited|gmbh|inc|llc|plc|co|company|group|holding)\b"

def norm_name(s):
    s = unicodedata.normalize("NFKD", s).encode("ascii", "ignore").decode().lower()
    s = re.sub(LEGAL, " ", s)
    s = re.sub(r"[^a-z0-9 ]", " ", s)
    return re.sub(r"\s+", " ", s).strip()

def norm_phone(s, cc="49"):
    d = re.sub(r"\D", "", s or "")
    if d.startswith("00"): d = d[2:]
    if d.startswith("0"):  d = cc + d[1:]
    return "+" + d if d else ""

def merge_key(row):
    if row.get("place_id"):
        return ("pid", row["place_id"])
    return ("geo", norm_name(row["name"]),
            round(row["lat"], 4), round(row["lon"], 4),
            norm_phone(row.get("phone")))
Four decimal places on the coordinates is about 11 metres, and that figure came out of two failed attempts. At three decimals, roughly 110 metres, the key merged separate shops inside one shopping centre and my count fell to 18,410 with real places gone. At five decimals the same restaurant collected from two neighbouring cells kept two rows, because the source returns slightly different coordinates depending on which viewport asked, and my count rose to 19,900 with duplicates surviving. Both counts are wrong. Eleven metres holds.
Name normalisation matters more than it looks. Stripping legal suffixes, folding accents, dropping punctuation and collapsing whitespace merged 1,240 rows on its own. Phone numbers arrive in six formats from a single source, and the international form turns all six into one string.
How I check it: I pull 50 merged groups at random after every pass and open them by hand, allowing at most one wrong merge in the 50. Then I run the inverse check, taking 50 pairs the key deliberately kept apart despite identical names, and confirm each pair really is two branches of the same chain. That second check is the one people skip, and it is the one that catches an over eager key eating a third of a franchise network.
Directories cap in a different shape
Directory sites look easier because their URLs are readable: a category slug, a city slug, a page number. They carry the same ceiling in different clothing, and they add a lie on top of it. One directory told me a category held 3,400 businesses and let me reach 1,000 of them.
The partition replaces the coordinate grid here. That directory exposes district filters, so 14 districts times 1,000 reachable rows gave me plenty of headroom, and the pass returned 3,180 unique businesses. The remaining 220 were hiding in the two largest districts, which each still hit the ceiling, and an A to Z filter inside those two brought the total to 3,375 against a claimed 3,400.
Sort order is the second lever and the cheaper one. Running the same partition sorted by rating and then sorted by name reaches two different thousand row windows of the same list. Where a directory offers three sort orders, one partition yields up to three overlapping windows, and the merge key folds them together at no extra cost.
How I check it: sum the partition counts and compare against the number the directory advertises. A sum landing within 2 percent of the claim means the partition is fine. A sum landing at exactly the ceiling times the partition count means every partition is still capped and the split has to go one level deeper. For directory work I keep the walkers in a scheduler, since grid passes driven through A-Parser accept the partition list as a plain input file and report per task counts I can compare against the claim without writing a reporting layer.
Why these sources start checking early
Map and directory sources ask questions sooner than most targets, and the reason has little to do with volume. It is the shape of the traffic. A person opening a map pulls tiles, images, fonts and a couple of scripts, looks at four or five cards, and wanders. My collector requests a search endpoint, walks it to maximum depth, and moves on to a rectangle exactly one cell width to the east, forever, with no tile ever fetched.
At 30 requests per minute from one address, check pages appeared within 20 minutes on my first attempt. At 9 requests per minute with pauses randomised between 1.2 and 4 seconds, and cells fed in shuffled order across the whole city, a six hour pass finished with zero check pages. The rate did the heavy work; the shuffle removed the marching pattern that made the rate obvious.
Two settings help more than any header tuning. Send the region and language parameters explicitly on every request, so the answer stops depending on where the exit address happens to sit, and keep the collector requesting from one endpoint family per session so the traffic reads as one client doing one thing.
For these passes I take private addresses for scraping runs, since a shared address arrives carrying whatever the previous tenant did to the same source last week, and map endpoints remember. I also keep private addresses with no shared history spread over separate subnets, because these sources count per network as readily as per address, and a whole range going quiet at once ends a pass at three in the morning.
How I check it: a counter of check pages per 1,000 requests, held per address. Above two per thousand I halve the rate on that address for the rest of the pass and mark it for a rest day. The counter lives next to the request log, and reading it takes one query.
Spreading the cells across the addresses in the pool
The assignment rule is short: a cell belongs to an address, and that binding holds for the depth walk, the retries and every child the cell produces when it splits. I assign by hashing the cell id modulo the pool size, which scatters each address across the map so no single address ever sweeps a neighbourhood in a straight line.
The pool size falls out of arithmetic I run before writing any collector code.
| Input | Figure | Where it comes from |
|---|---|---|
| Requests in the pass | 39,032 | 1,148 cells across 34 terms with their depth walks |
| Collection window | 6 hours | the aggregator wants the file before the morning meeting |
| Required rate | 109 per minute | requests divided by the window |
| Safe rate per address | 9 per minute | measured by pushing one address until a check page appeared |
| Addresses at the minimum | 13 | required rate divided by safe rate |
| Working pool | 20 | the minimum plus half again for retries and splits |
The extra seven addresses are working capital. Splits arrive mid pass and add cells nobody counted at the start, retries consume slots, and I always hold one address aside to open a card by hand and compare it against what the collector stored. On the pass where I sized to exactly 13, the first dense category produced 90 unplanned child cells and the file was two hours late.
For the grid itself I run a datacenter pool on owned hardware, because the arithmetic above only holds when the per address rate is a property I control. I keep IPv4 addresses assigned one per cell block so the mapping from address to region of the city stays fixed across nights, which makes a night to night comparison of counts meaningful. Traffic on these passes is modest per request and enormous in aggregate, so addresses with no traffic meter keep a long pass from slowing down in its final third, and a pass that finishes at a steady rate is a pass whose numbers I can compare against yesterday.
How I check it: no address may carry above 12 percent of the pass, and the error rate per address gets its own column in the summary. An address running three times the failure rate of its neighbours is telling me something about itself, and grouping errors by address before grouping them by cell has saved me from redesigning a grid that was working fine.
Completeness without a reference list, and what the log has to carry
Nobody hands you the true count. The chamber register that exposed my first pass covered one category out of 34, and building that comparison for every term would cost more than the collection. So I estimate completeness from the pass itself, with four readings that agree or argue.
The cap-hit rate comes first, the share of cells that returned the ceiling. Under 1 percent means depth is no longer losing me anything. The marginal yield comes second: unique places added per 100 cells over the last tenth of the pass. When those final cells still contribute above 2 percent of the total, the grid is too coarse somewhere and the pass ends before the city does. The overlap ratio comes third, the share of places seen from two or more cells, which should sit above 20 percent on my margin setting. A low overlap ratio means the seams are open and places are falling through them.
The fourth reading is a hold-out list, and it costs an hour once per city. I take 60 businesses from an independent register, spread across categories and districts, and check how many the pass found. My last run returned 57 of 60. All three misses belonged to a category term I had never added to the list, so the gap sat in my vocabulary while the grid was doing its job perfectly well, and that distinction only became visible because the hold-out list existed.
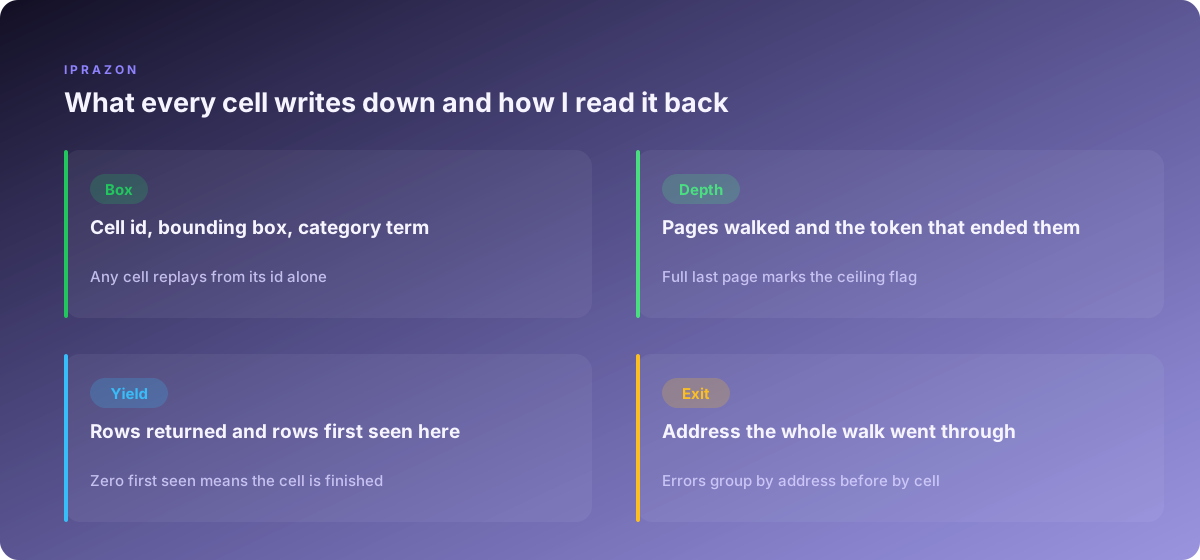
The log is what makes every one of those readings possible. One line per cell, written whether the cell succeeded or failed, holding enough to replay the cell from nothing.
{"cell":"c00417","parent":"c00104","edge_m":500,
 "box":[52.4931,13.3812,52.4986,13.3901],
 "term":"dental clinic","pages":3,"rows":60,"ceiling":true,
 "first_seen":11,"dupes":49,"status":[200,200,200],
 "token_age_ms":[0,2214,2198],"exit":"a07","retries":0,
 "started":"03:14:22","ms":7420}
Three fields there carry more weight than the rest. The ceiling flag drives the split queue, so a pass produces its own next pass without me touching it. The first_seen count tells me whether a cell is still earning its requests, and a run of cells reporting zero first seen is a region I can widen next time. The exit field lets me answer the question that always arrives eventually, which is whether an odd result came from the source or from one address behaving differently to the other 19.
I keep those lines for 30 days and read them once a week. That habit turned into a table of per source ceilings, per source safe rates and per city grid depths that I now carry into every new project, and the second city took me two days against the three weeks the first one cost. The grid, the ceiling and the merge key are the whole trade here, and once the log records all three per cell, a collection that looks complete and a collection that is complete stop being the same claim made twice.
Related pieces from this series: how to test a proxy before you rely on and what to measure when a proxy feels slow. If you are sizing a pool for grid work, start from the request arithmetic above and take addresses sized for grid passes with the retry headroom already included.